Karanbir Singh

UM4002-2

COVID19 MANAGEMENT IN AHMEDABAD CITY

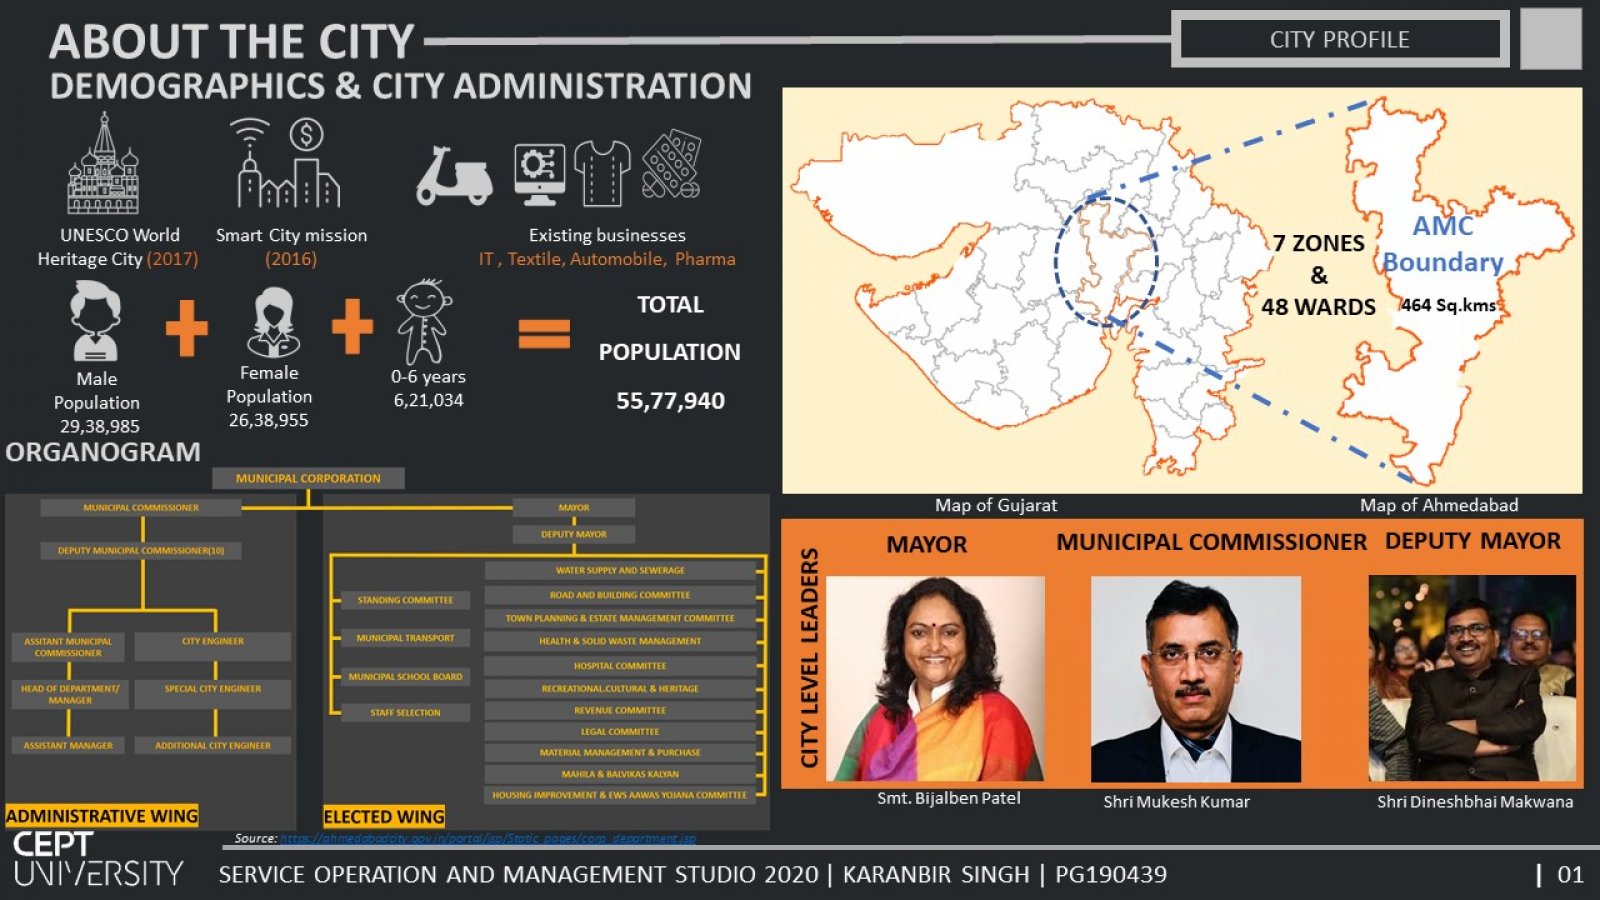
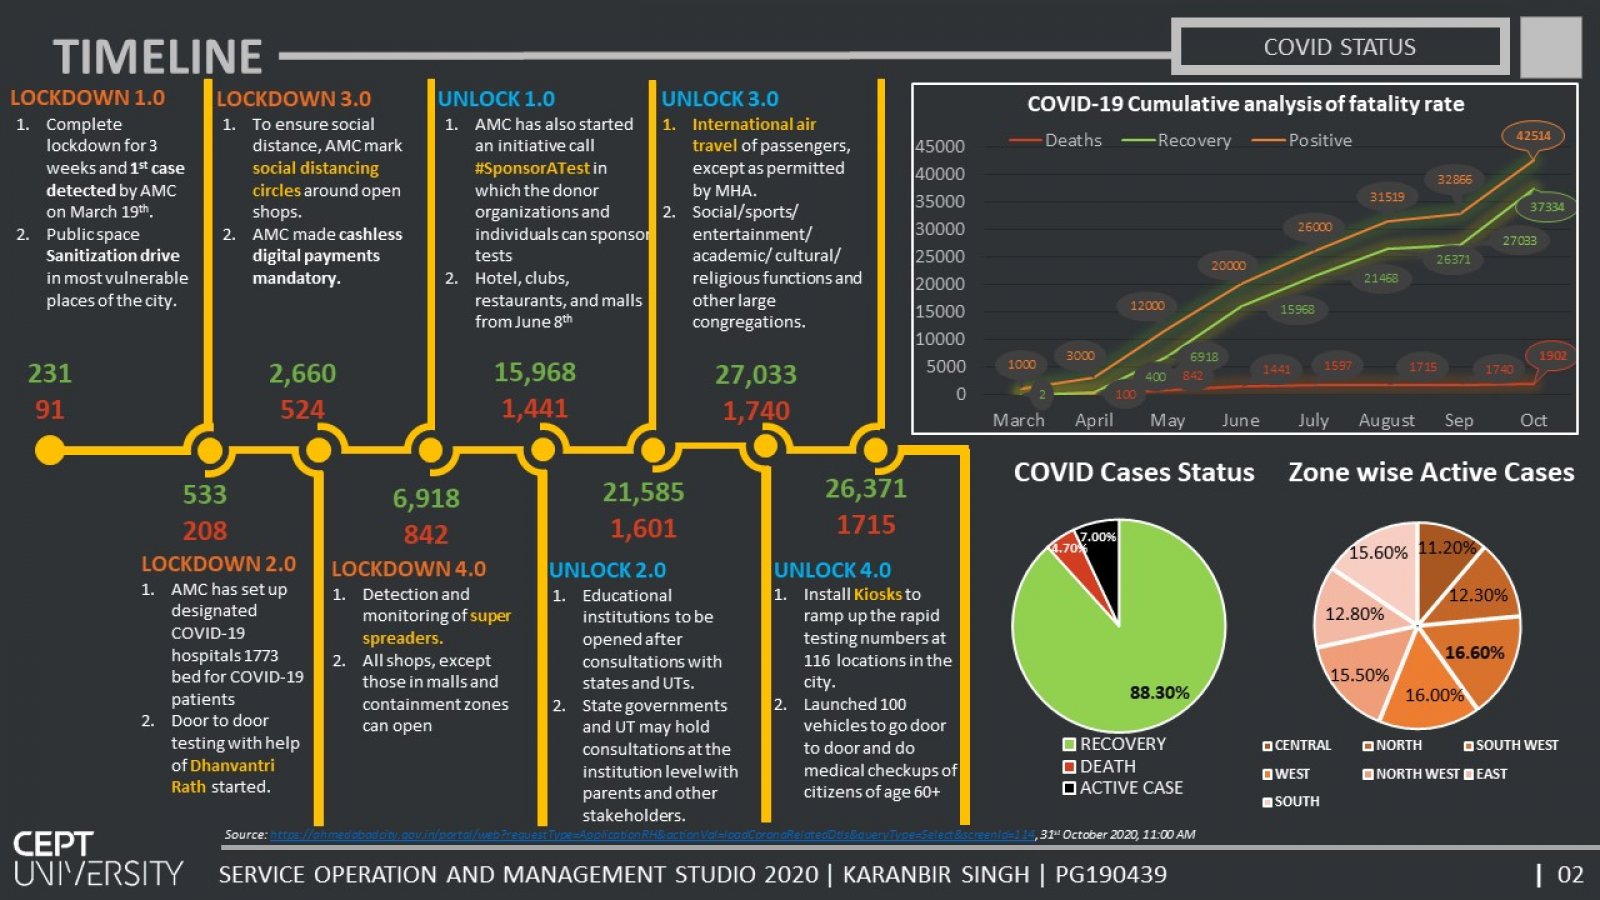
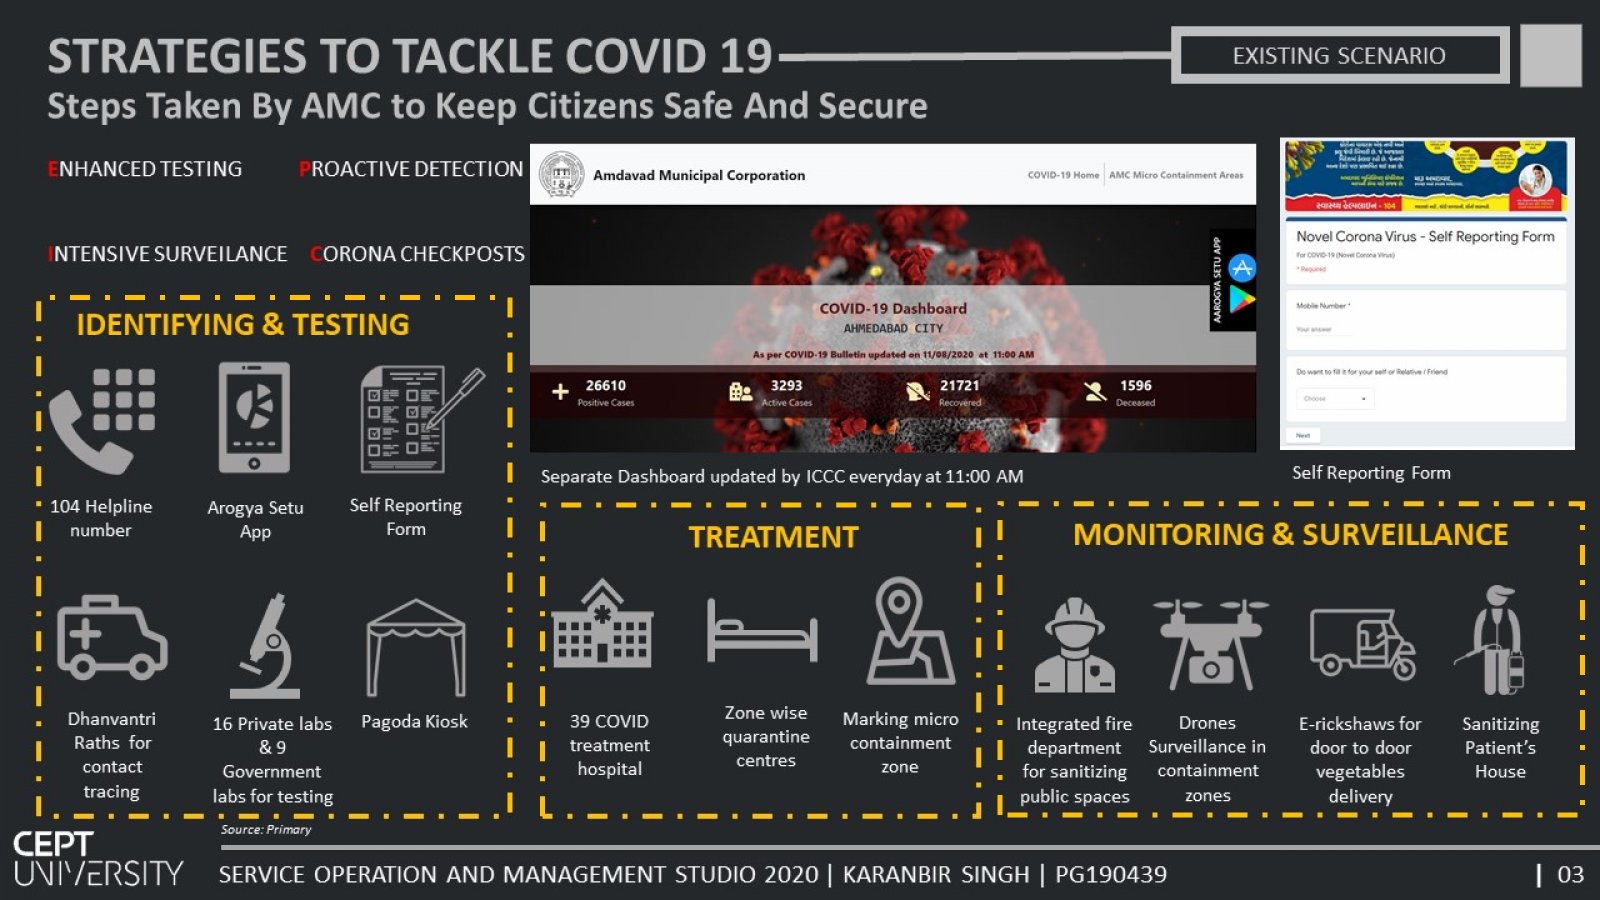
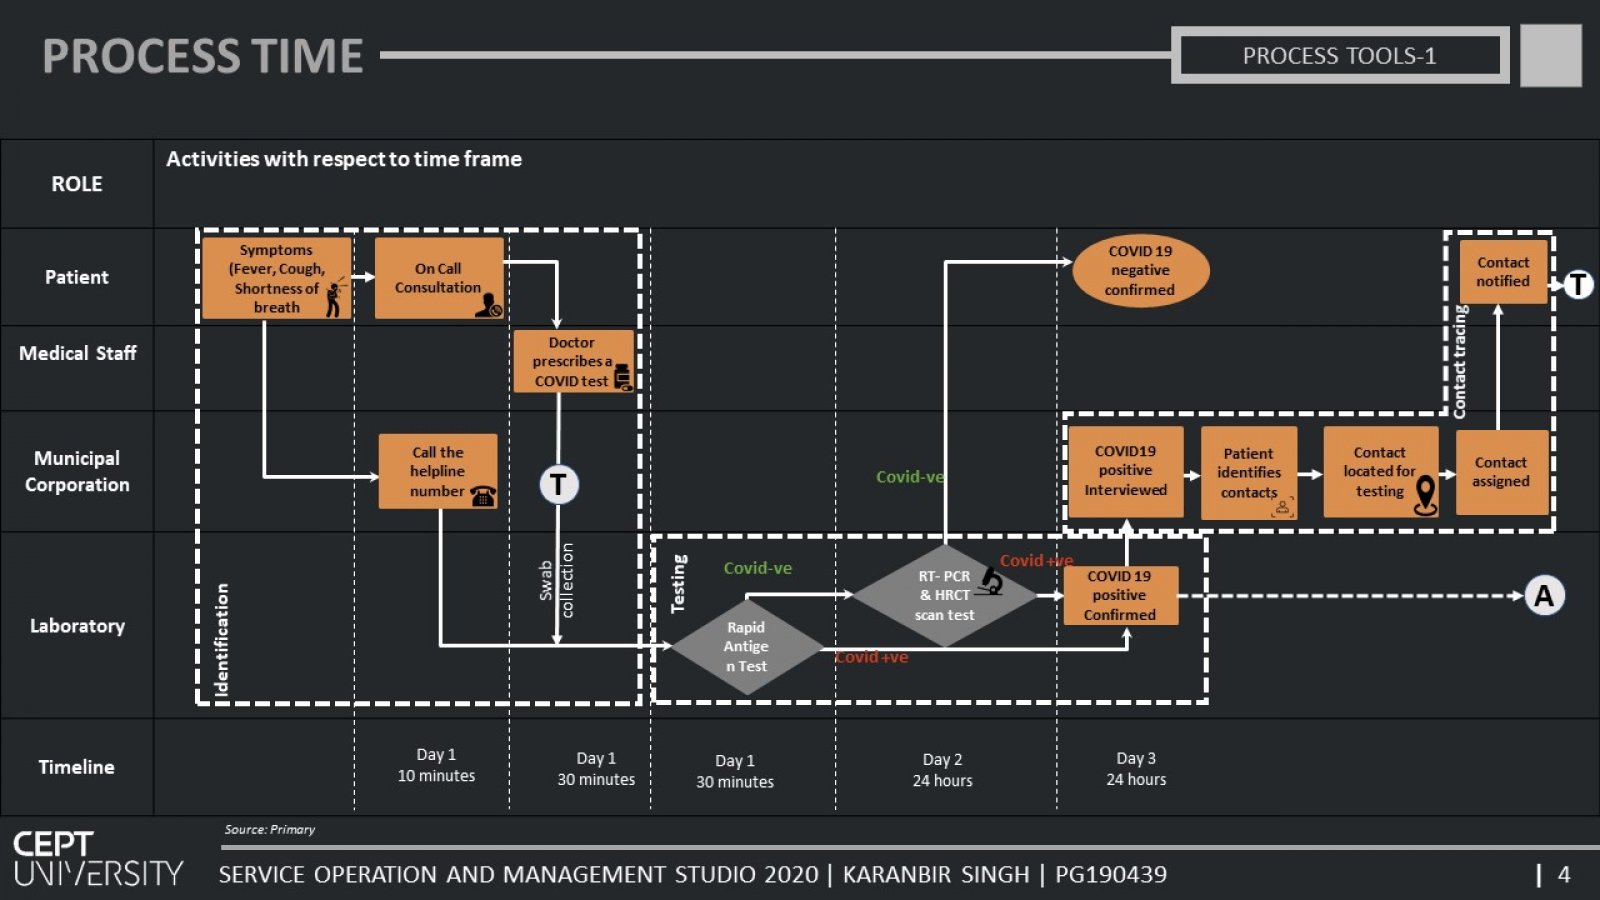
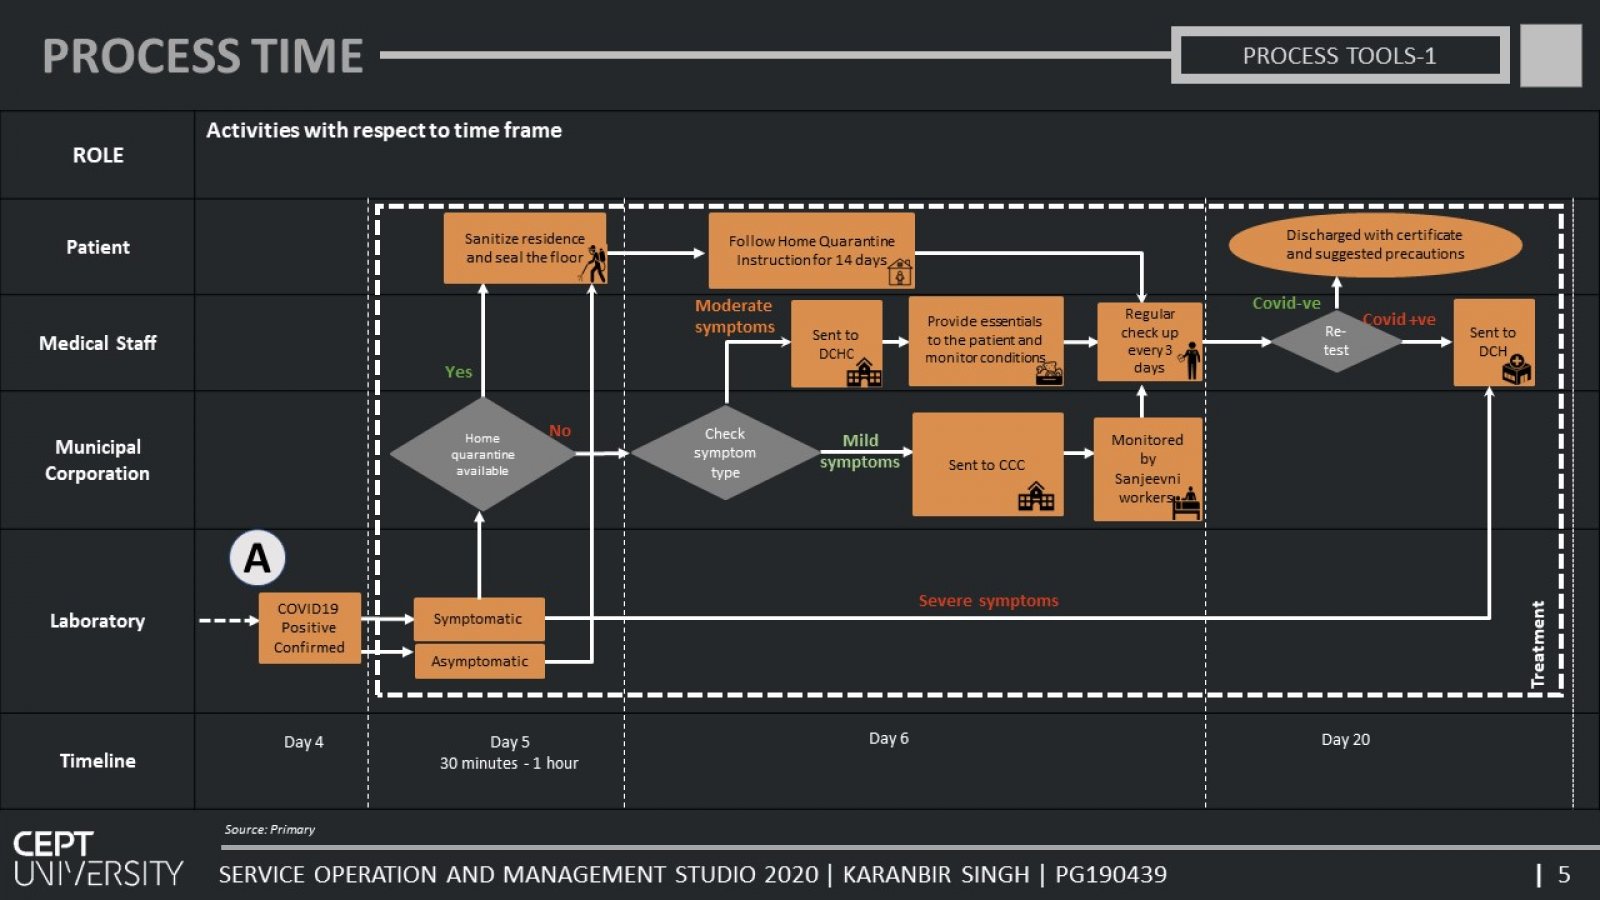
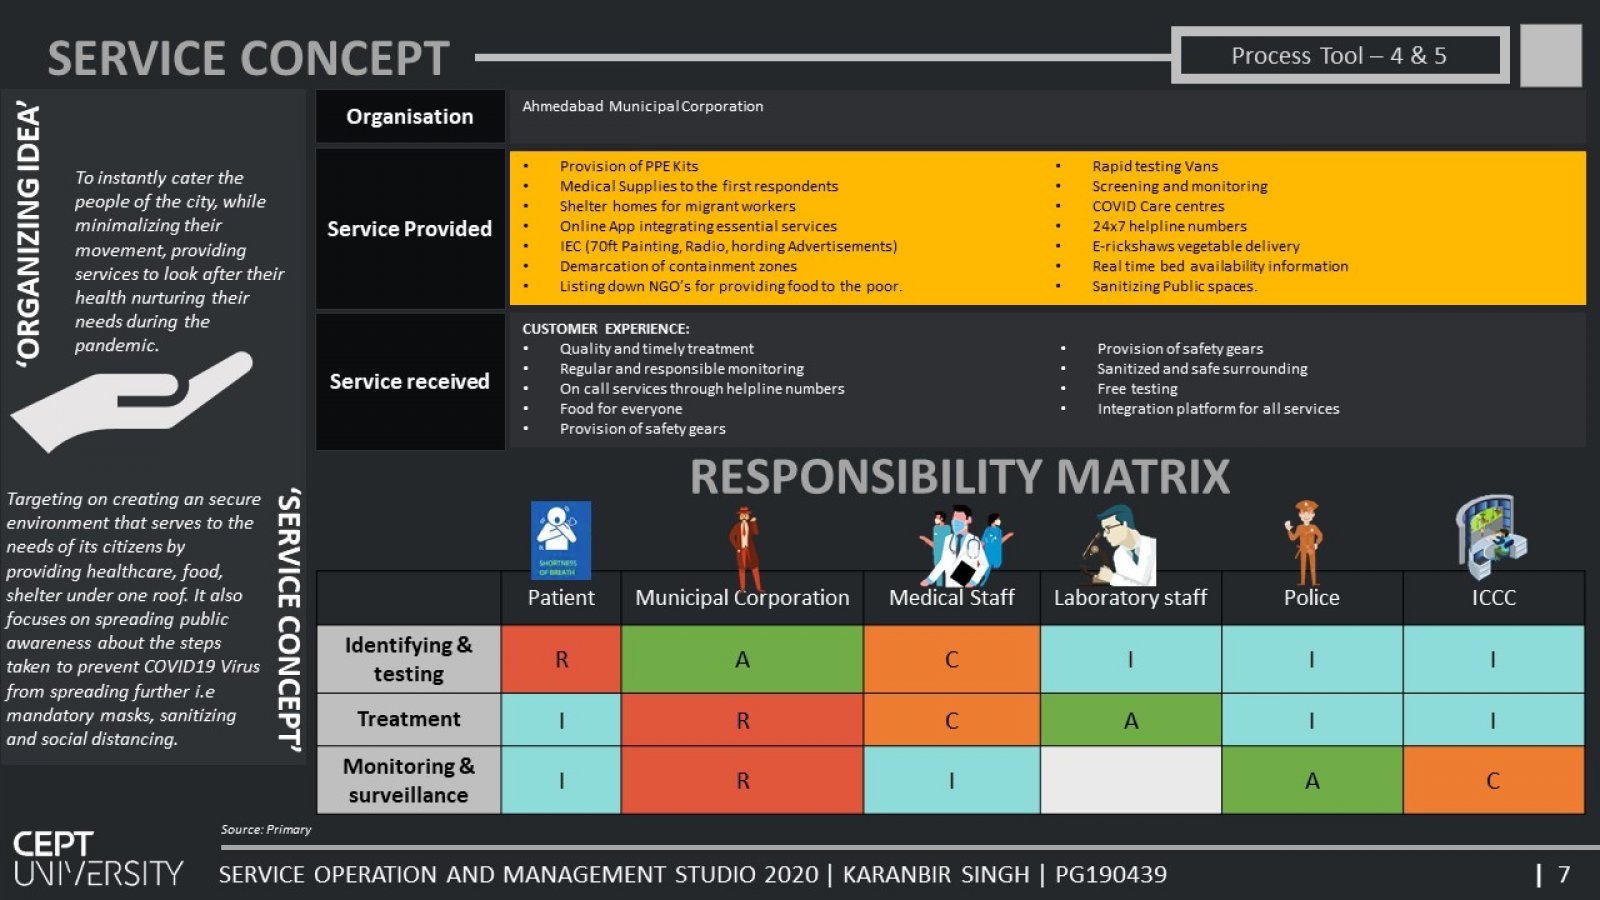
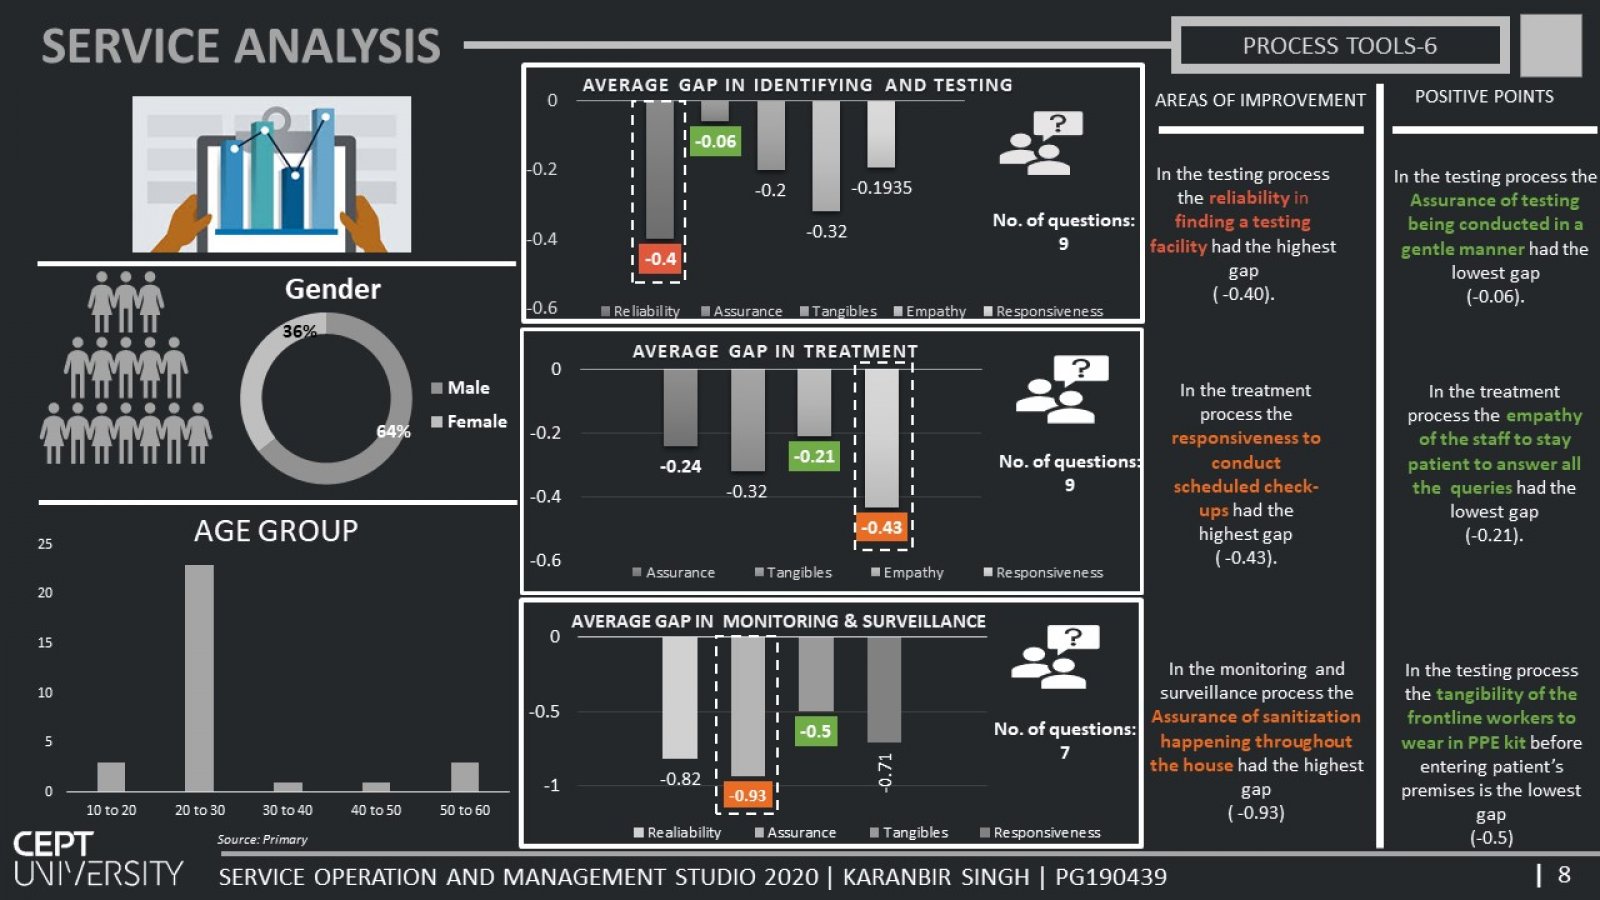
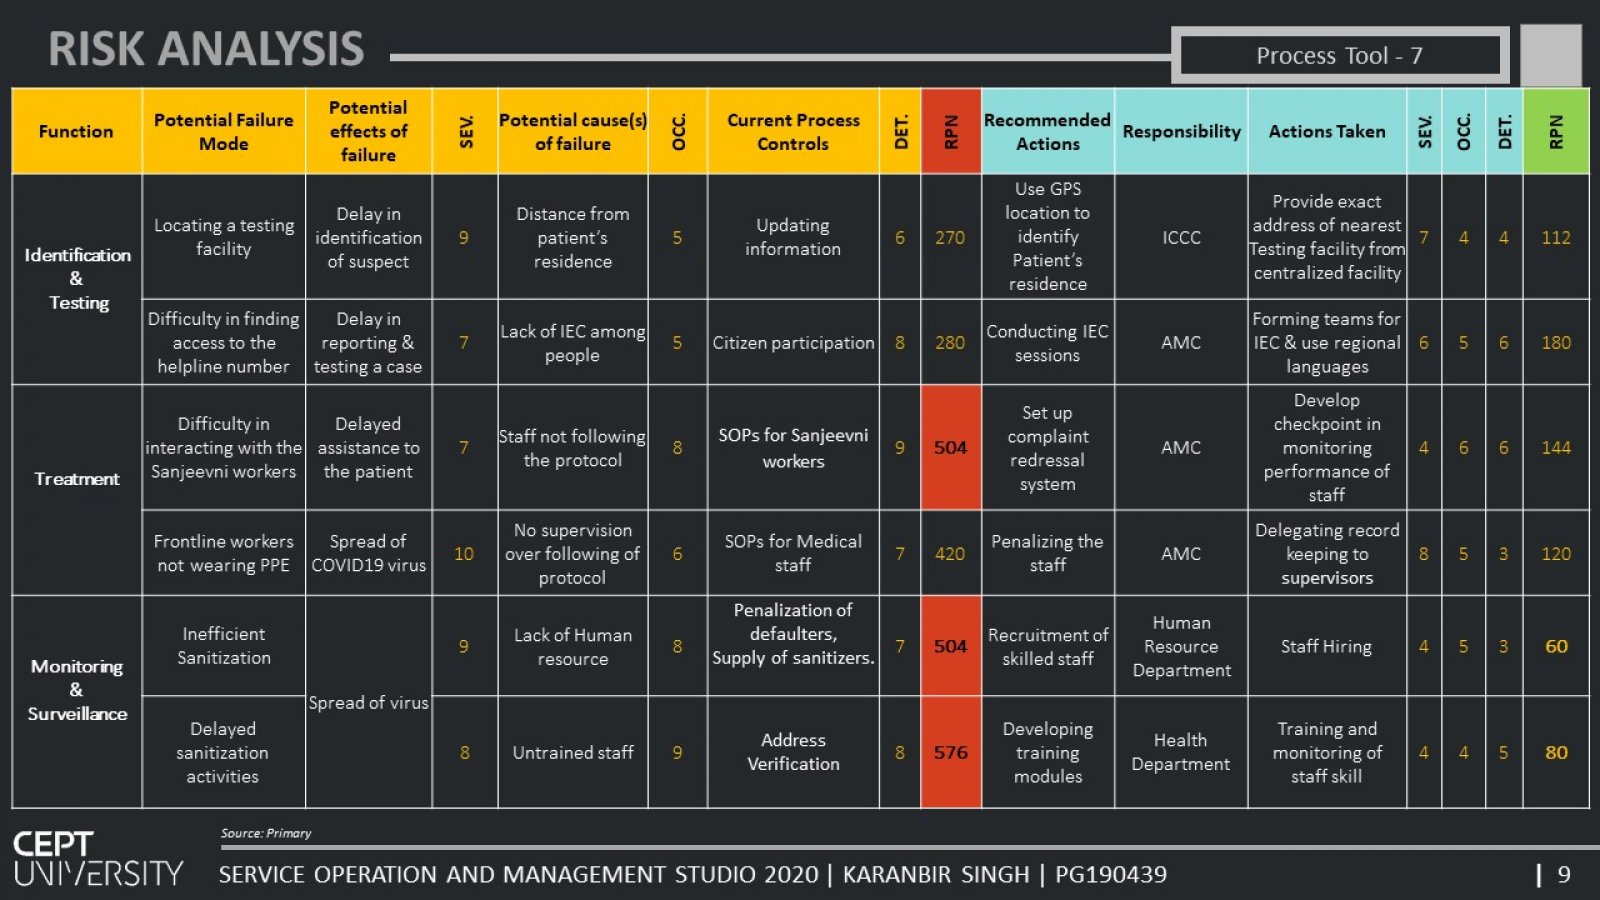
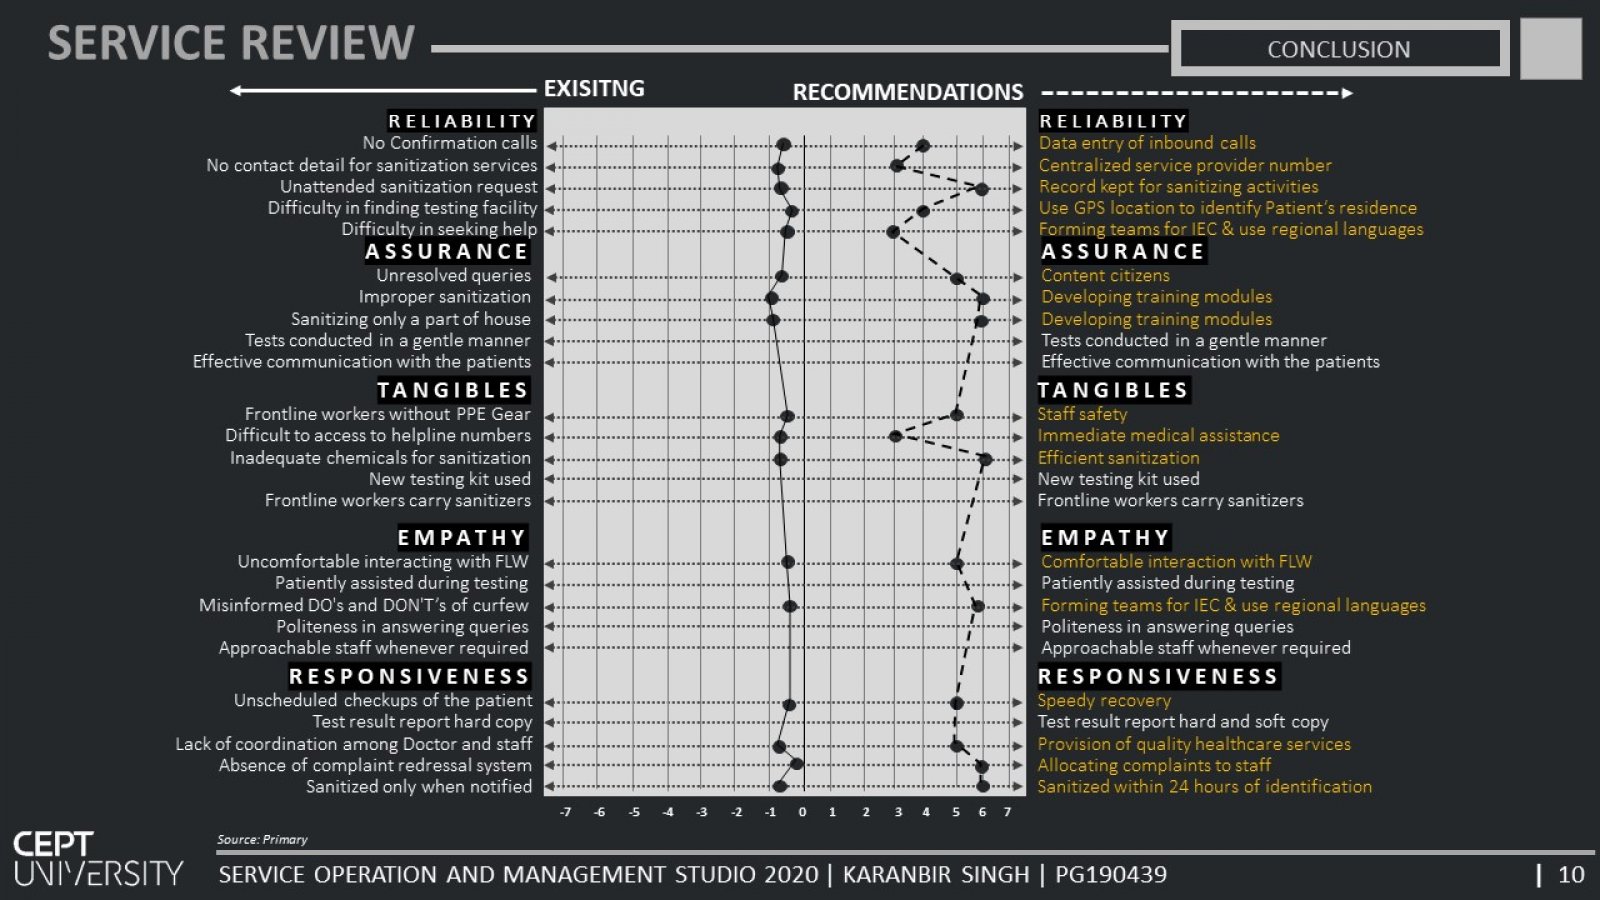
The COVID-19 scenario of a city in  Ahmedabad is studied which shows the COVID profile with respect to confirmed, recovered and deceased cases. Authorities managing COVID-19 cases in the city has been categorized under 3 processes which are Identification & Testing, Treatment and Monitoring & Surveillance with various help of Service Operations tools. After analyzing the service gaps, suitable recommendations are listed down in the Service Audit Profile for the better management of COVID-19 cases in the city by various stakeholders involved. Tableau: linked: https://public.tableau.com/profile/karanbir.singh7110#!/vizhome/GujaratdataforCOVIDupdated/Story1?publish=yes  

View Additional Work

Report Content

Ahmedabad, in western India, is the largest city in the state of Gujarat. It is also number World heritage city.The Municipal Corporation was formed in the year 1950. The city was included in the smart city mission in the year 2016. Ahmedabad has a population of about 56 lakh and covers an area of 464 sq kms according to 2011 census. The city is divided into 7 zones and 48 wards. The existing businesses are Pharmaceutical, Textile, Automobile, Information Technology.

The COVID status as of 31st October indicates that there are: 42,514 Confirmed COVID Positive cases Out of which 37,334 has recovered and 3,278 are still Active cases. 1902 people were the unfortunate ones who lost their lives in this pandemic. According to the AMC COVID dashboard’s west zone of Ahmedabad has the most active cases and the city has 88.3% recovery rate.

AMC focused on a very simple strategy to enhance testing, proactive detection, intensive surveillance and create corona check posts. So accordingly for ease of understanding I divided all the activities under 3 heads Identification techniques Treatment strategies Monitoring and Surveillance

Here we see with respect to time how identification & testing process takes place. There are 2 tests which are being done in Ahmedabad, 1st is Rapid antigen test and 2nd is RT-PCR test, done just for the precautionary measure. We can see that by the end of 2nd day a patients has his test results and contact tracing starts from there on.

Here we can see that how a COVID positive patient is quarantined and how the services are provided to them by Sanjeevni workers at CCC. Similarly all essential services are provided by the medical staff at DCHC. After 14 days of being quarantine a patient is discharged based on the test results.

Process worksheets: The tables depicts the 3 key process and their respective events. Profile worksheets which had the following highlights, the service risks and key controls of the processes were marked to further improve the service delivery process.

The Responsibility matrix is showing that in majority of the cases the responsibility lies majorly with Municipal corporation and medical staff are consulted in the processes. The process of give and take of information happens at ICCC, Police and Patient’s end  

Service Analysis: A Survey conducted on COVID POSITVE PATIENTS out of which 64% were male and 36% were female. Majority of the people were from the age group of 20-30. The analysis depict the above inferences.

For Risk analysis top 2 parameters of each process were taken for assessment. From this 3 parameters were identified where RPNs were found in unacceptable risk category i.e above 480. Recommended actions have been mentioned on the right side with the new RPN.

In the Service Review, left side shows the existing scenario and on the right side we can see the reflection of recommended action.

Project Video