Your browser is out-of-date!
For a richer surfing experience on our website, please update your browser. Update my browser now!
For a richer surfing experience on our website, please update your browser. Update my browser now!
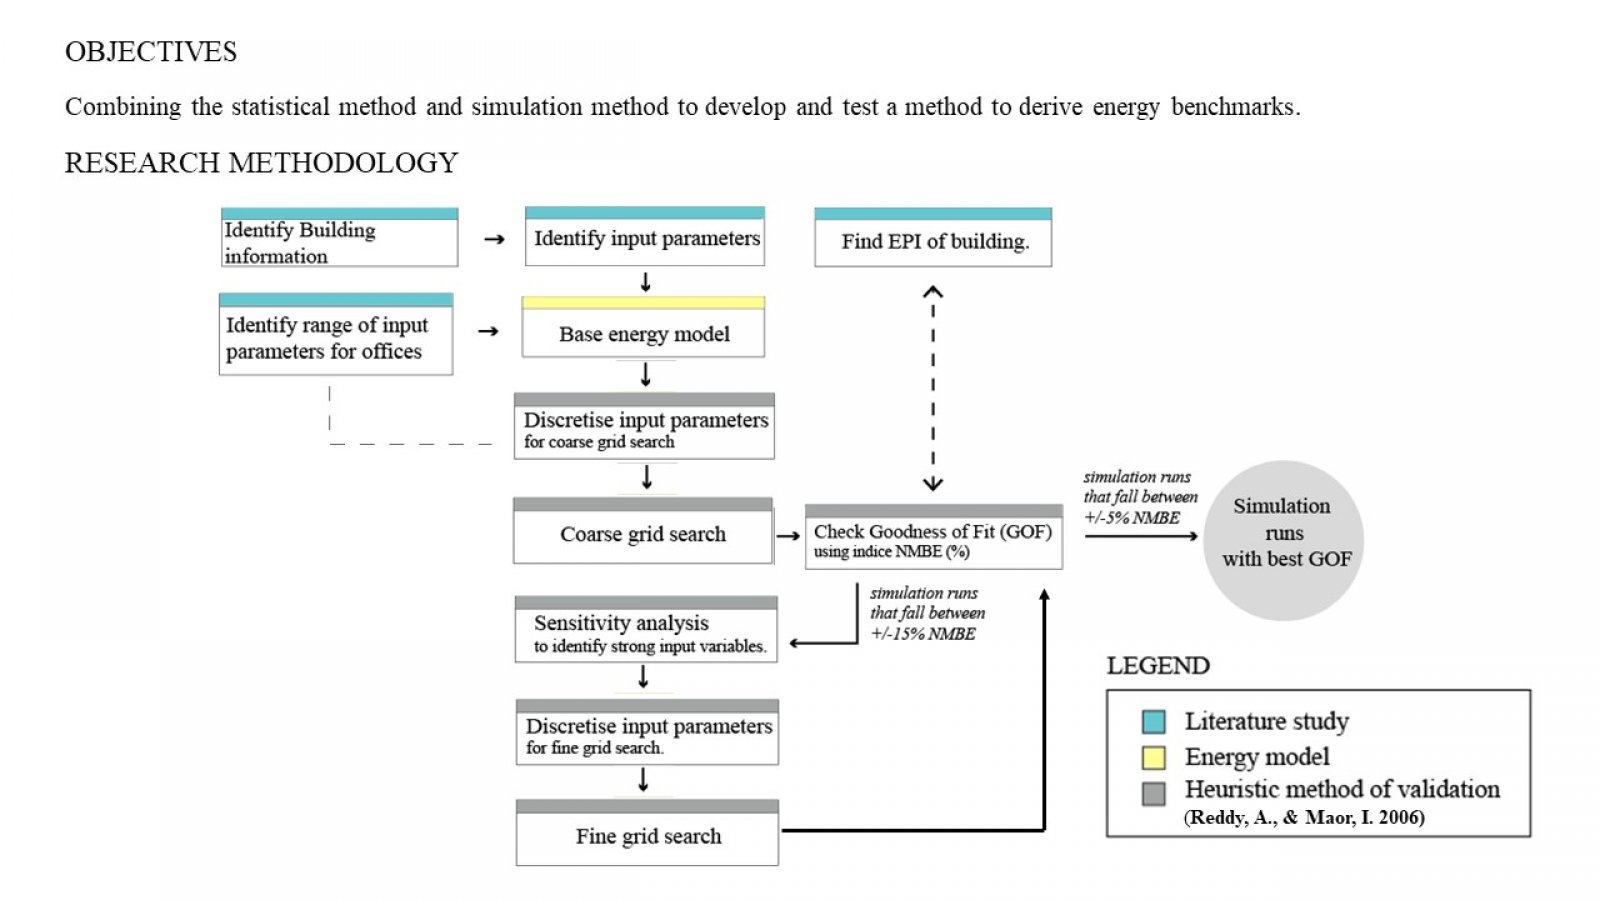
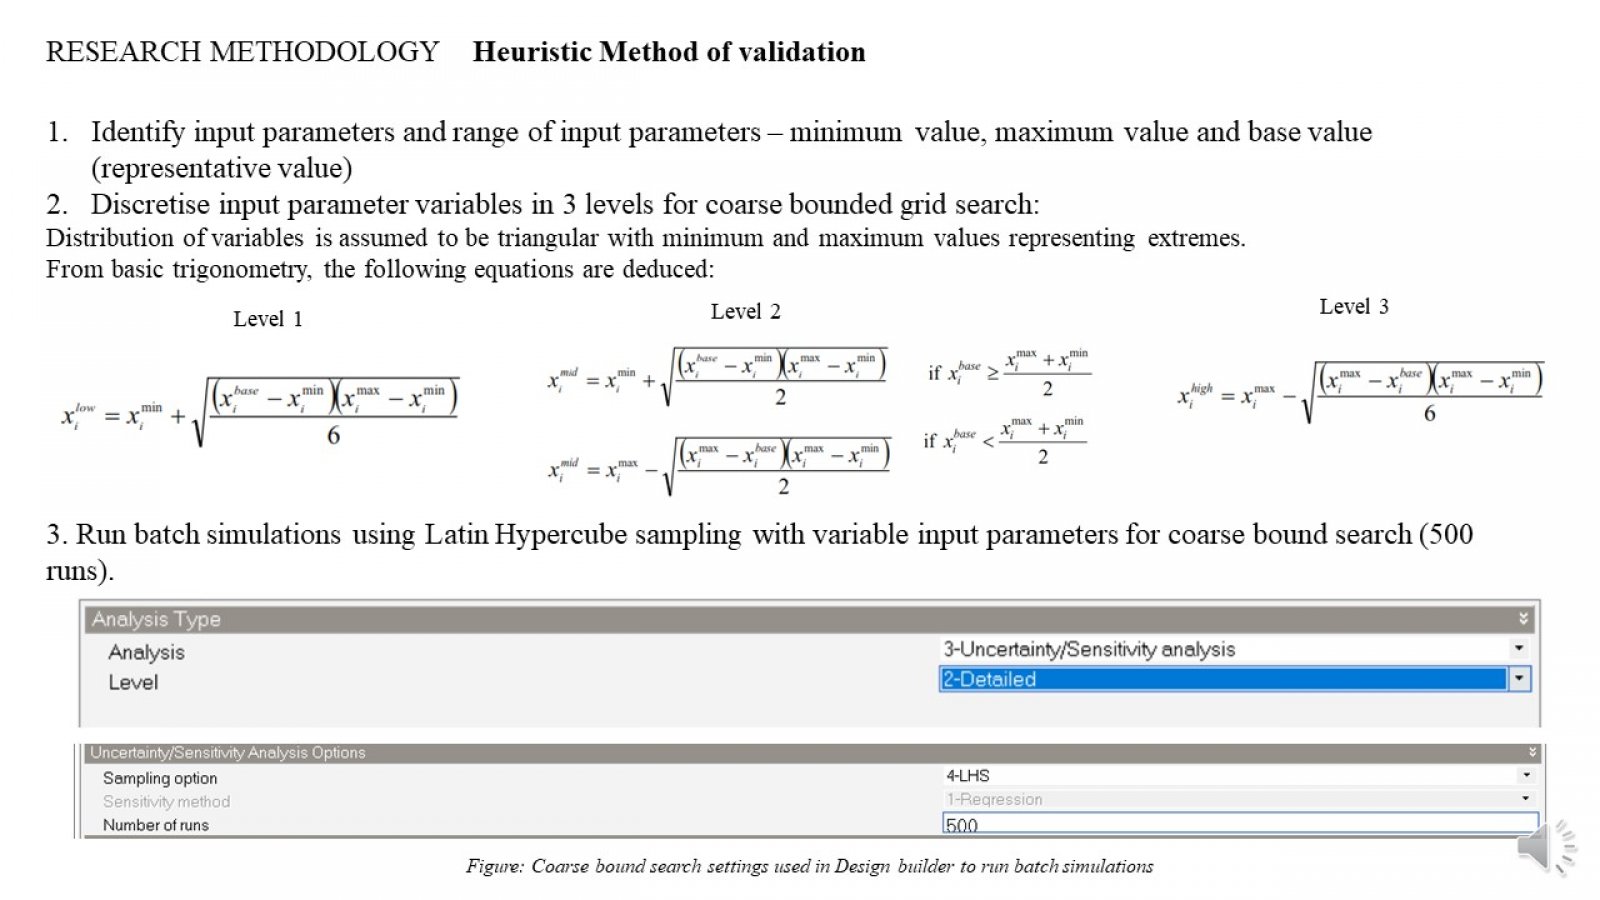
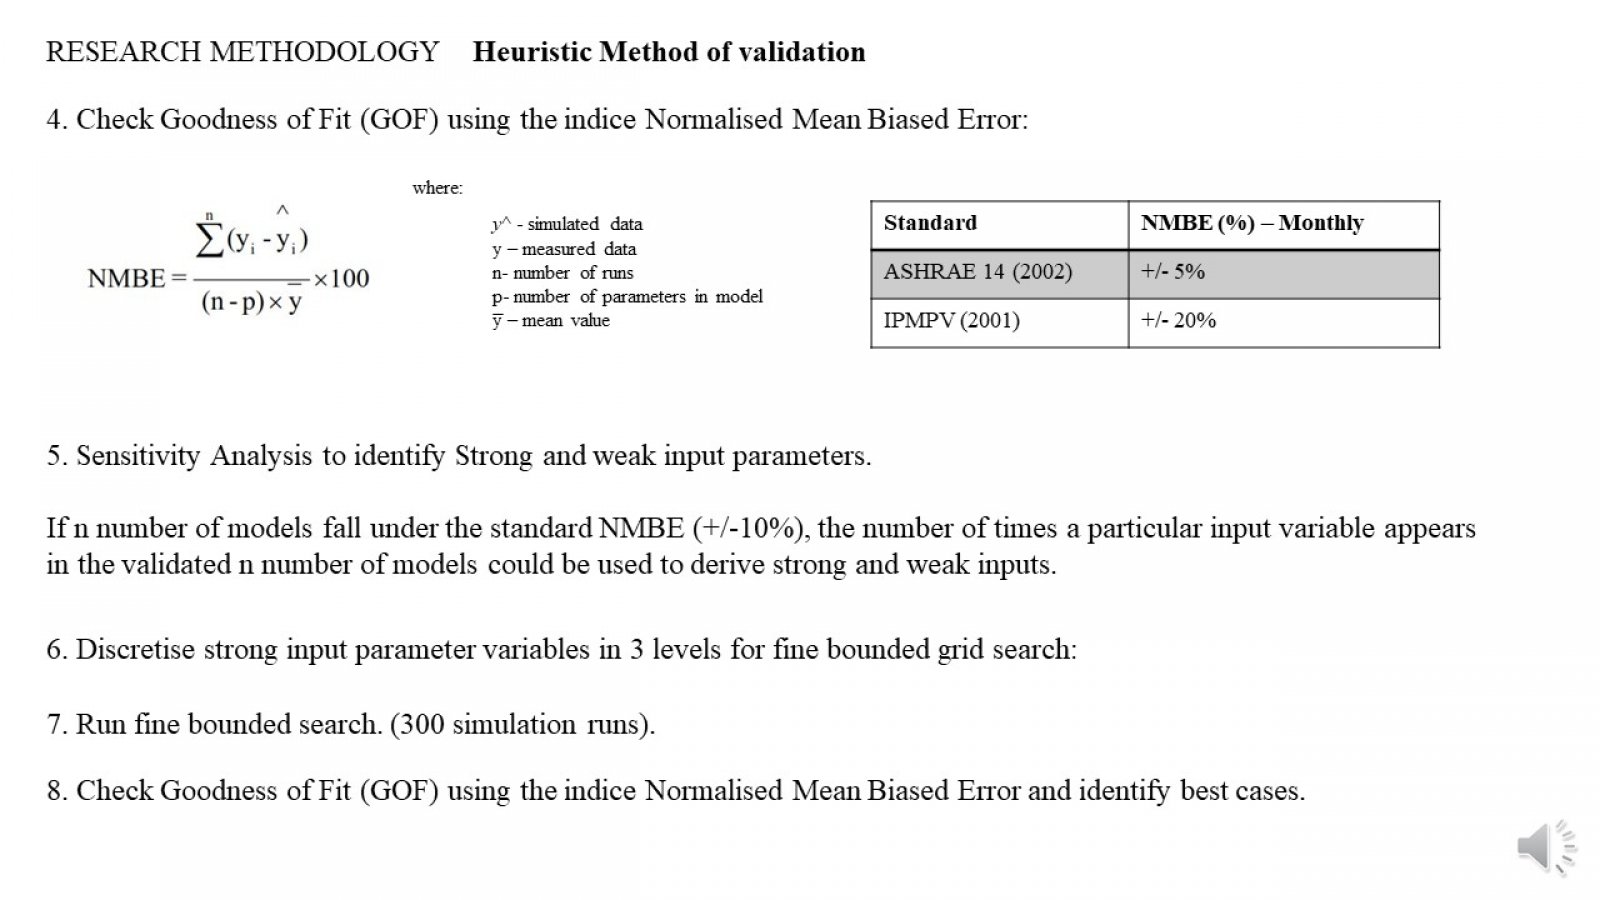
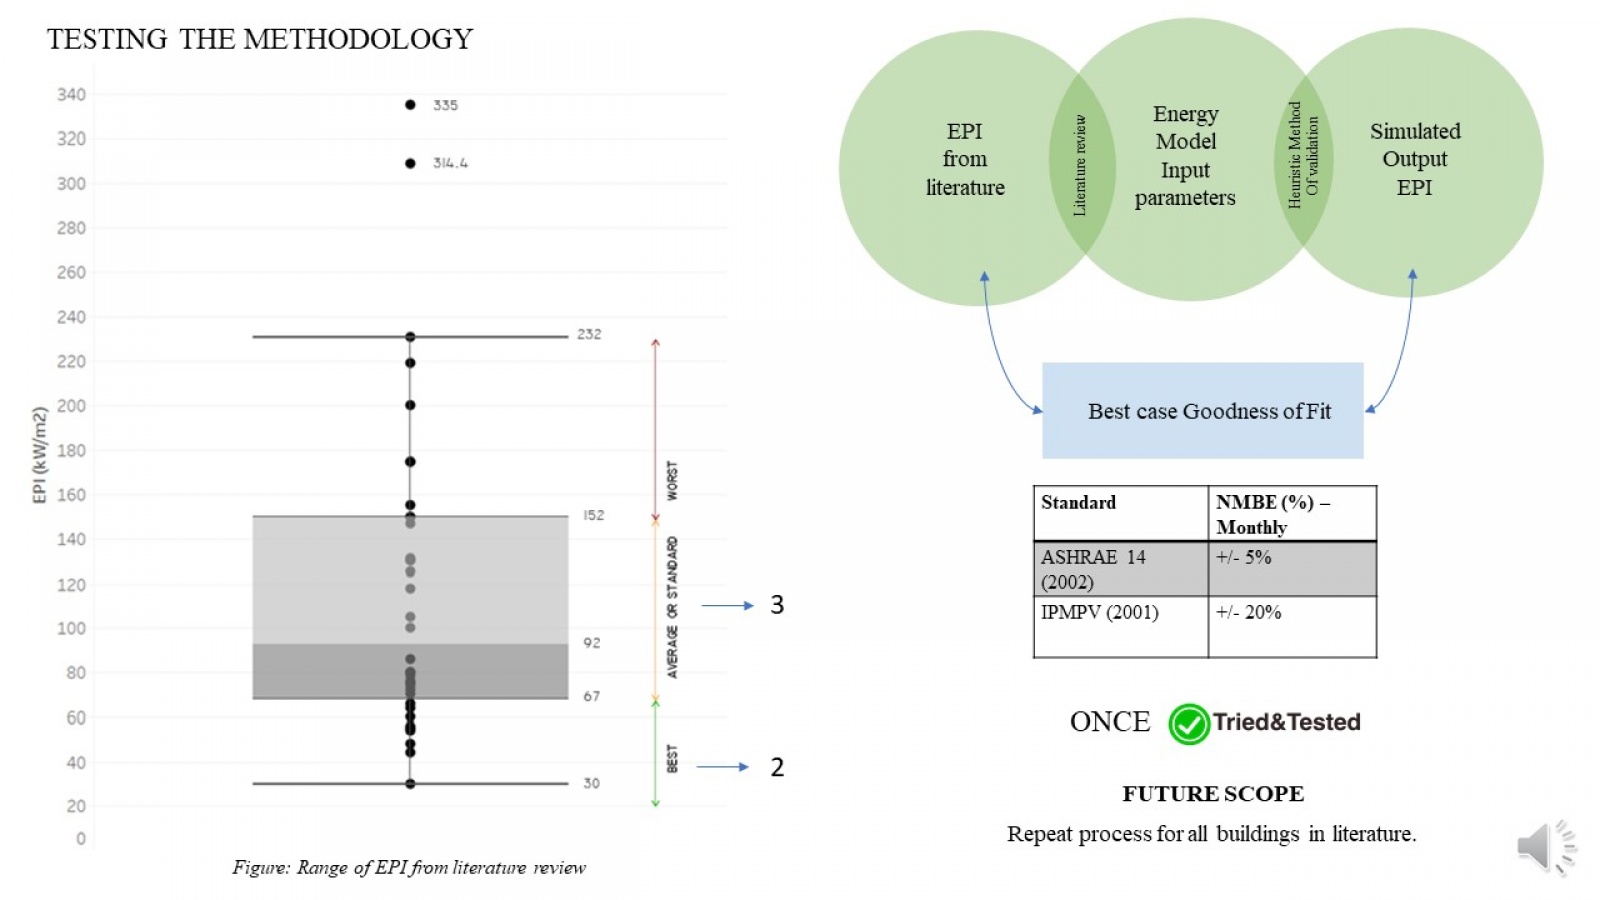
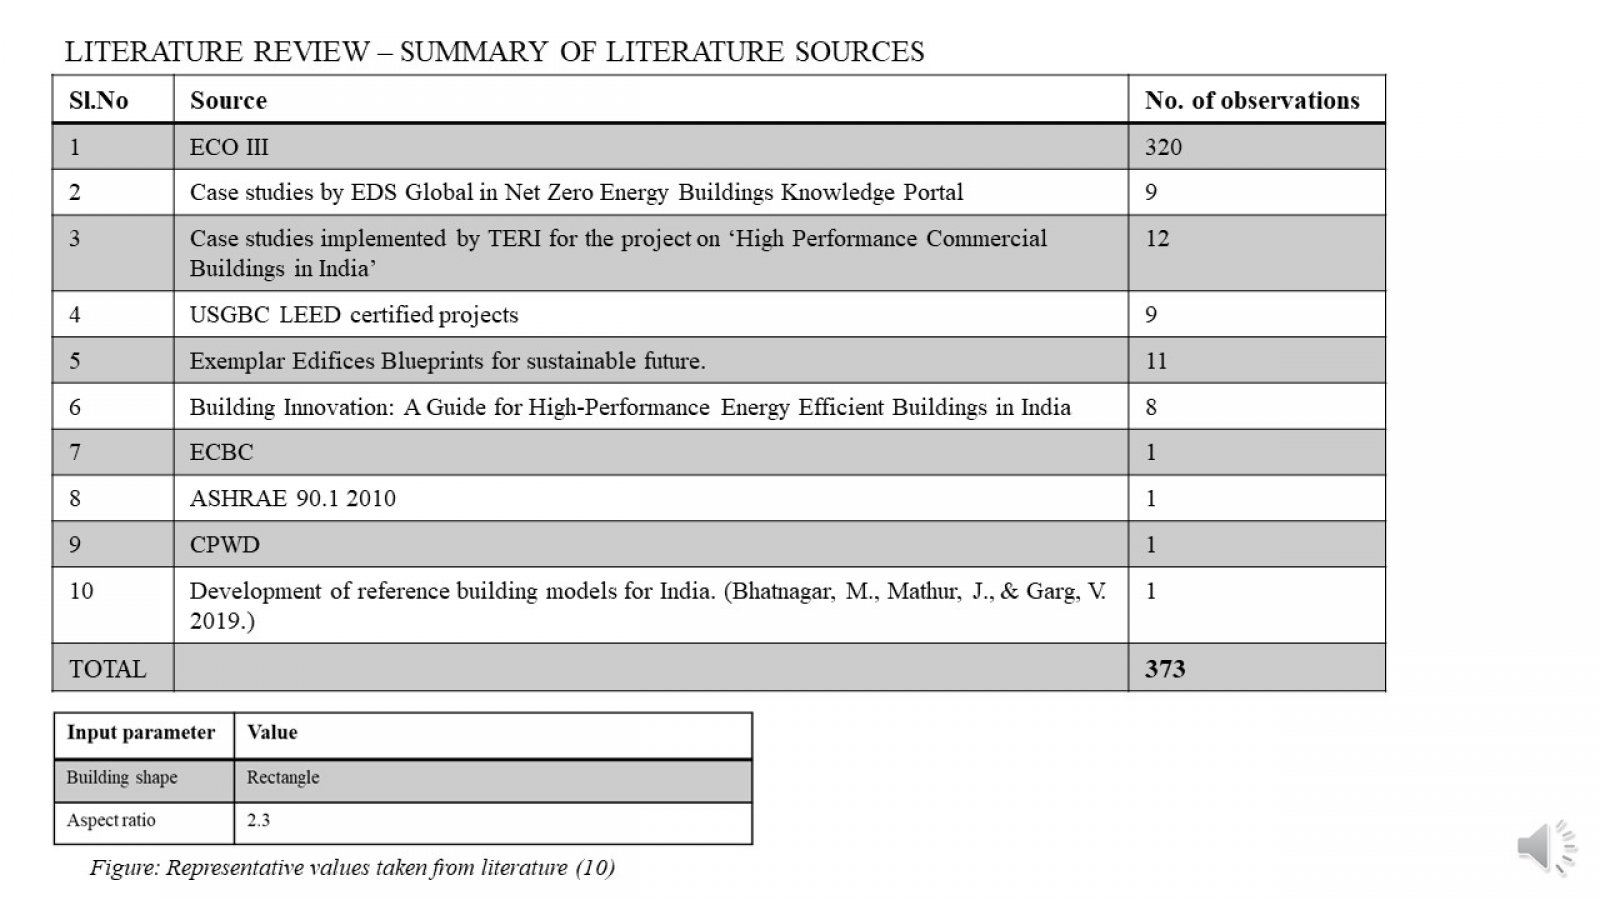
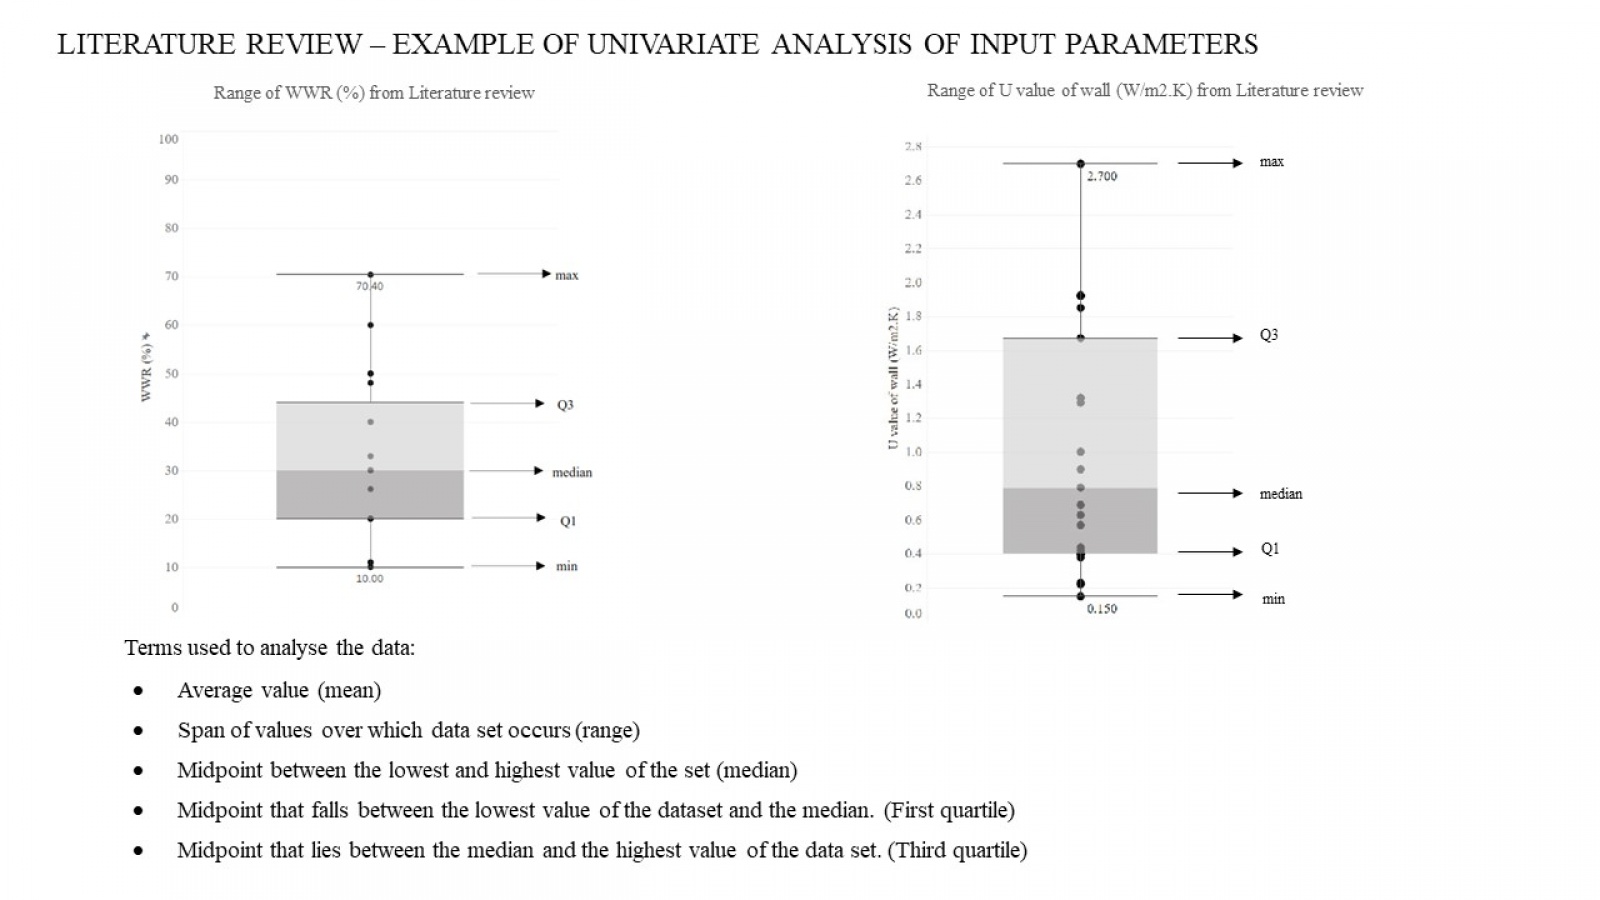
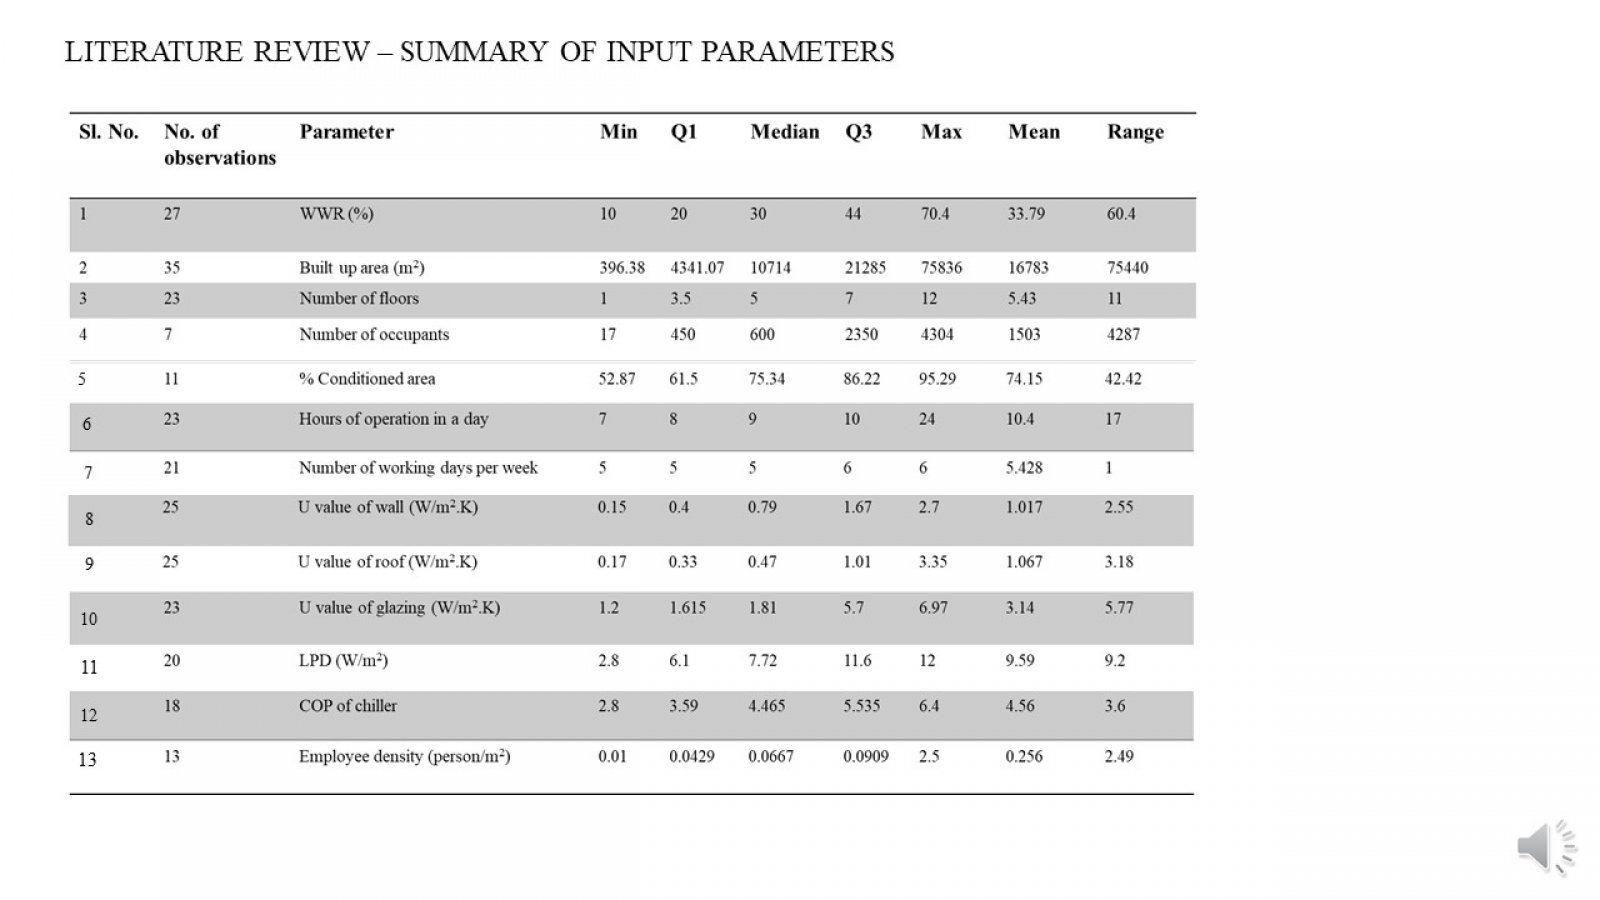
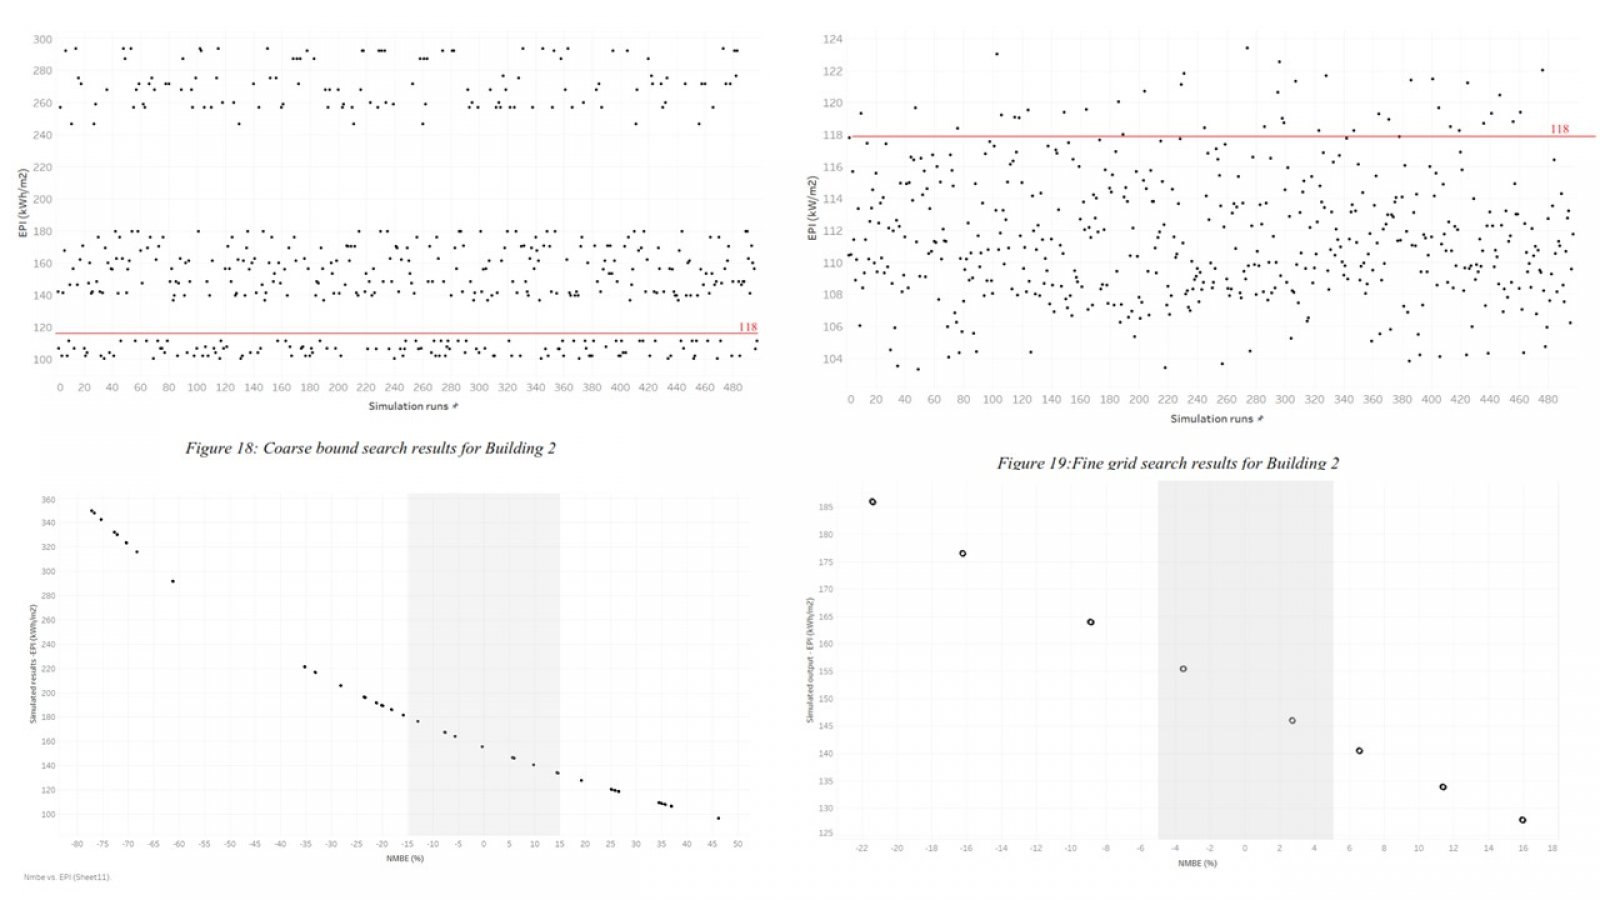
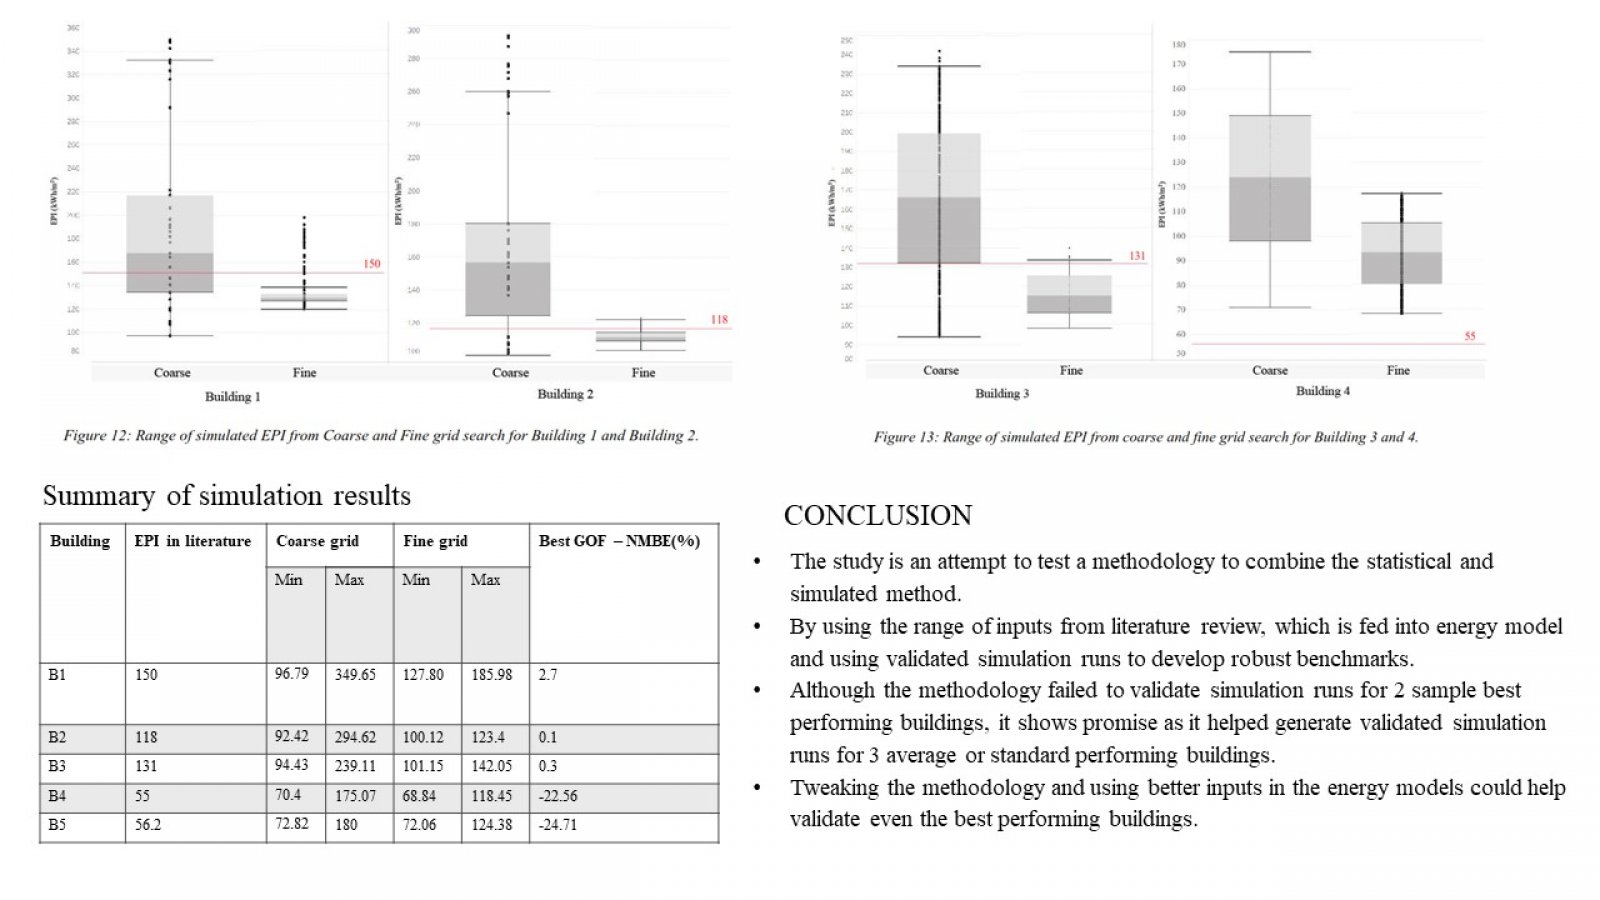
The fast-increasing levels of energy consumption have raised concerns over the excessive usage of resources and subsequent environmental impacts. India being a developing country, the power consumption has been increasing at a greater pace. The commercial building area accounts for 33% of the total built area, and it is increasing at a rate of 8-10% annually. Commercial buildings in India account for nearly 8% of the total electricity supplied by utilities. Electricity use in this sector has been growing at about 11-12% annually, which is much faster than the average electricity growth rate of about 5-6% in the economy. In such a condition, it is important to understand the pattern of energy consumption in commercial buildings and develop robust benchmarks. This would help designers and owners to set targets to choose appropriate technology, materials, products and retrofit measures for buildings and help users to operate the building efficiently. The statistical method for benchmarking requires a database of a large population of buildings in order to derive a robust benchmark. Due to difficulties in acquiring data for system level data for large population of buildings, there would be minimal information about buildings such as the annual energy consumption, ?oor area, regional weather conditions, number of occupants etc. Hence there would be low granularity of data in the database. The aim is to device a method to derive benchmarks for energy consumption in office buildings of India using both simulation and measured data. Through literature study from various sources, a database of input parameters for energy model, like built-up area, number of occupants etc. and Energy Performance Index (EPI) of 373 office buildings is gathered and analysed. Major source of data came from the ECO-III project, for which a standardized questionnaire was used to collect energy data of office buildings. From the analysis, range of the input parameters are derived and representative values for numerical input parameters like built up area, would be calculated using weighted mean. Appropriate assumptions would be made for the unknown input parameters, based on the literature review. A heuristic method of validation is carried out using batch simulations where the input parameters are discretized into levels and random combinations of these levels of each input parameters are made to carry out large number of simulation runs (300-500). The initial coarse grid search uses the range of input parameters from literature study to derive 3 levels of input variables. The simulation output of EPI would be compared with the EPI from the literature for Goodness of Fit (GOF). The Normalised Mean Bias Error (NMBE) indice is used to check GOF. A margin of +/- 15 % NMBE is used to narrow down the search. From these narrowed down simulation runs, strong input parameter variables are identified by checking which variables repeat the most in the simulation runs that fit the NMBE threshold. A fine grid search which uses these strong input parameter variables would be carried out to identify the simulation runs with best Goodness of Fit (GOF). The same method of validation of simulation results is carried out for five buildings from the literature. These simulation runs would help identify end use consumptions and input parameters of best performing buildings, standard or average performing buildings and worst performing buildings which would help in developing benchmarks.
