Ekasma Joshi

UI4051

PUI22443

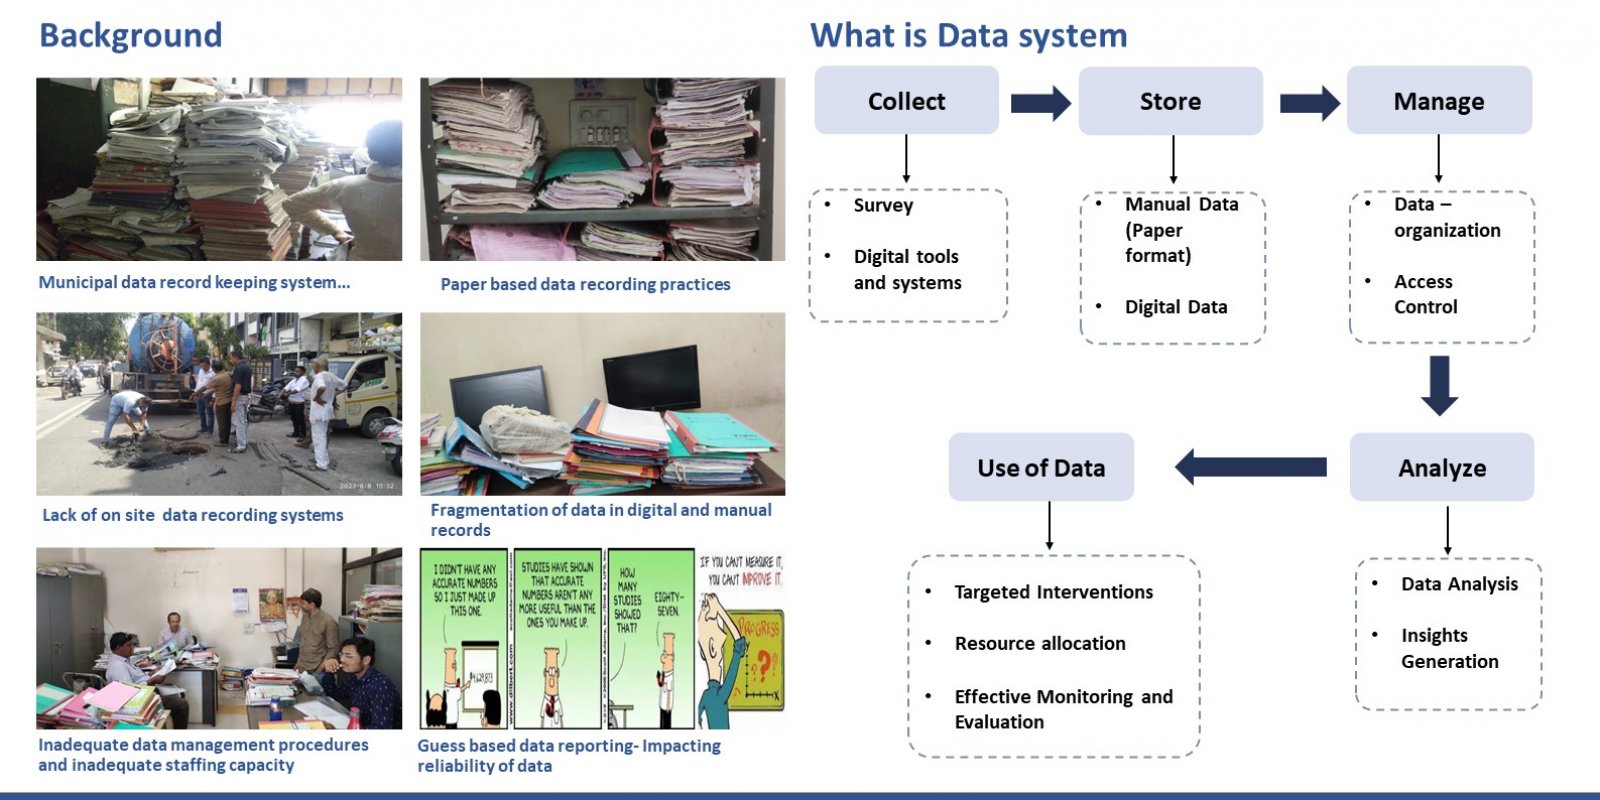
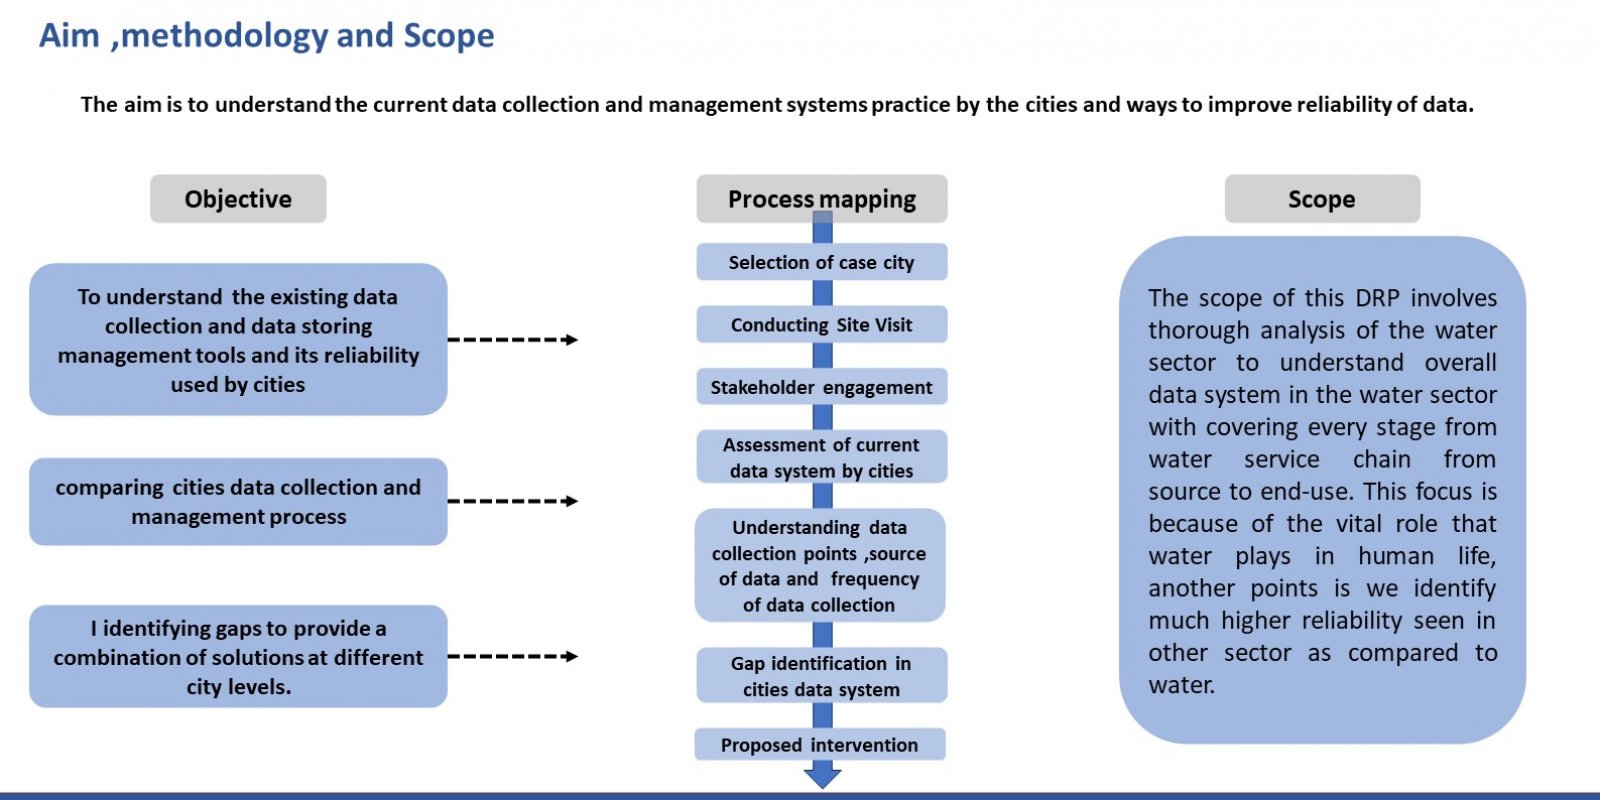
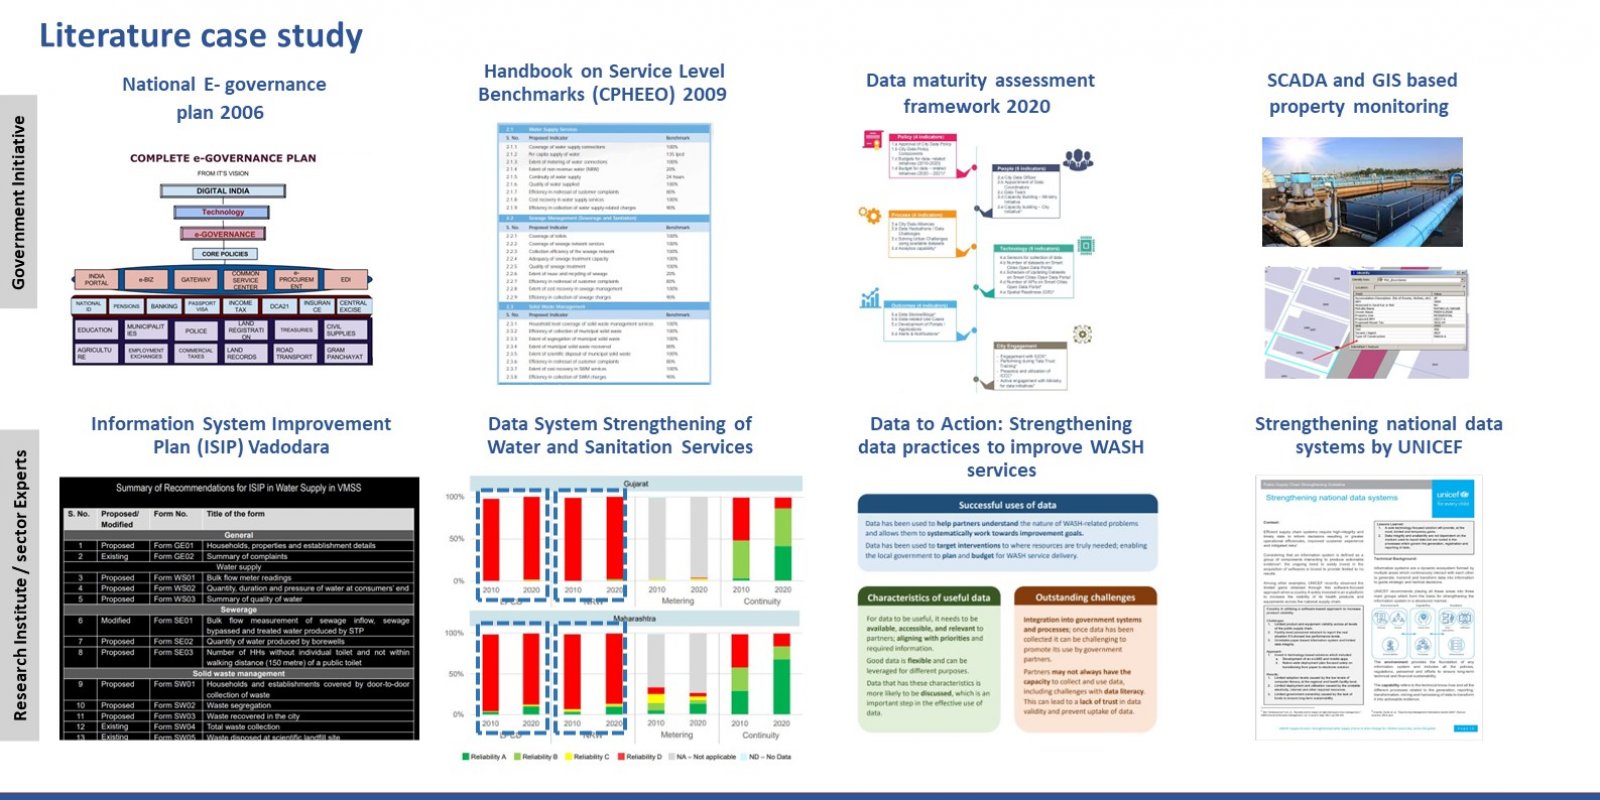
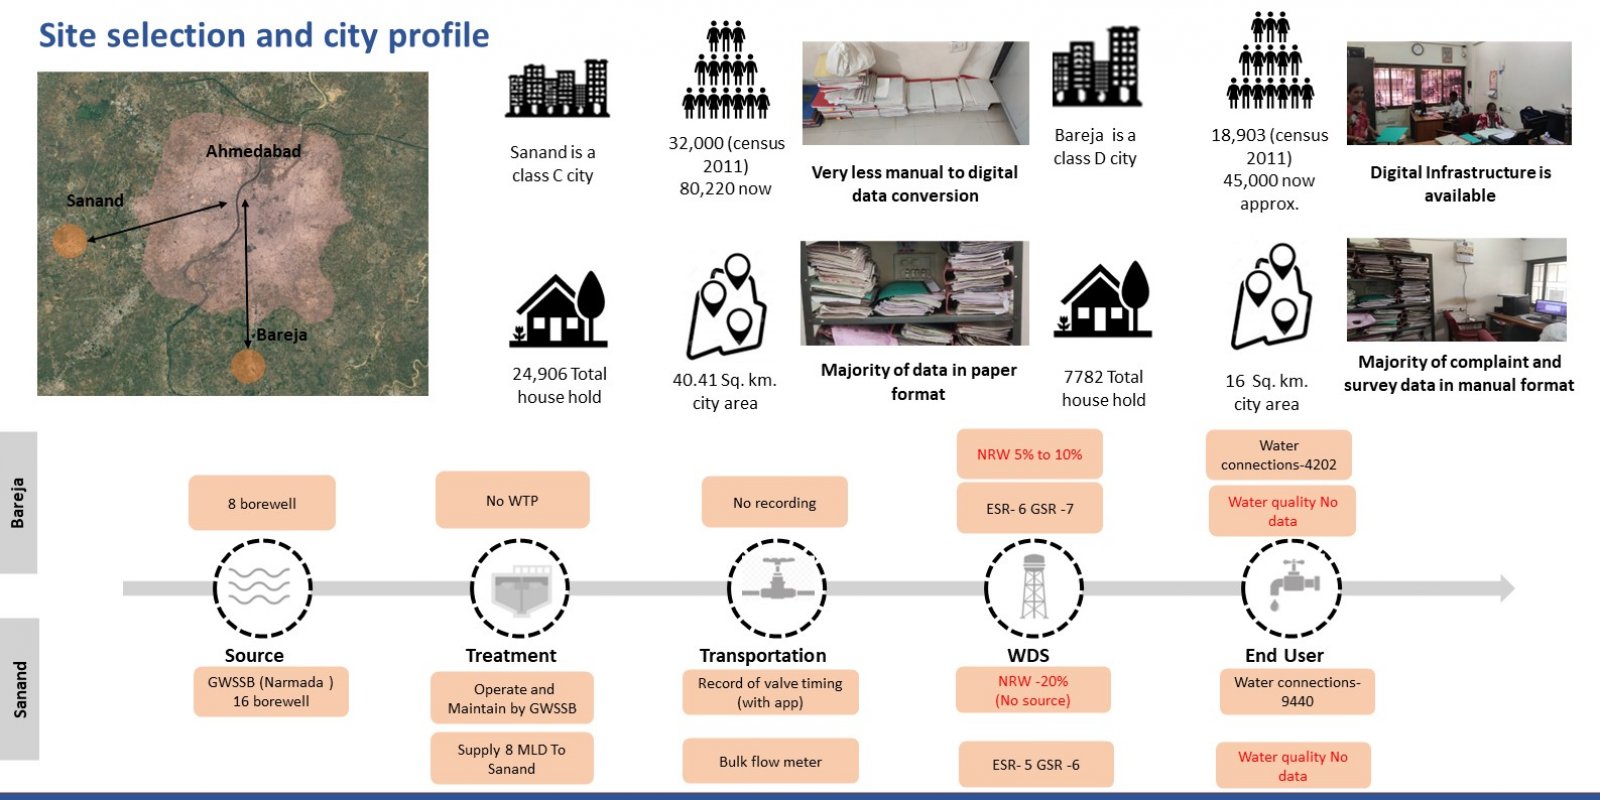
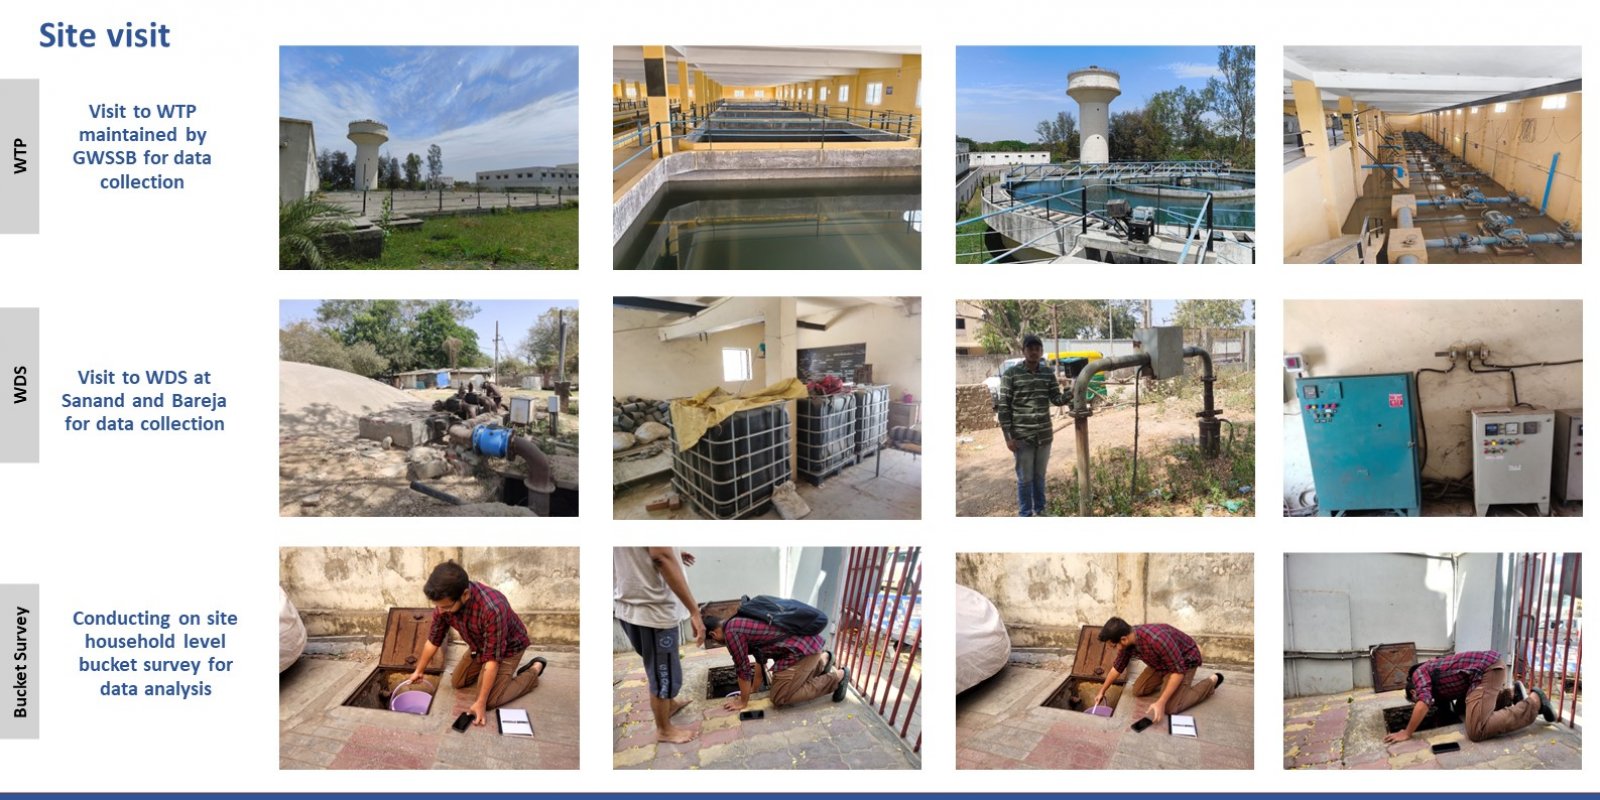
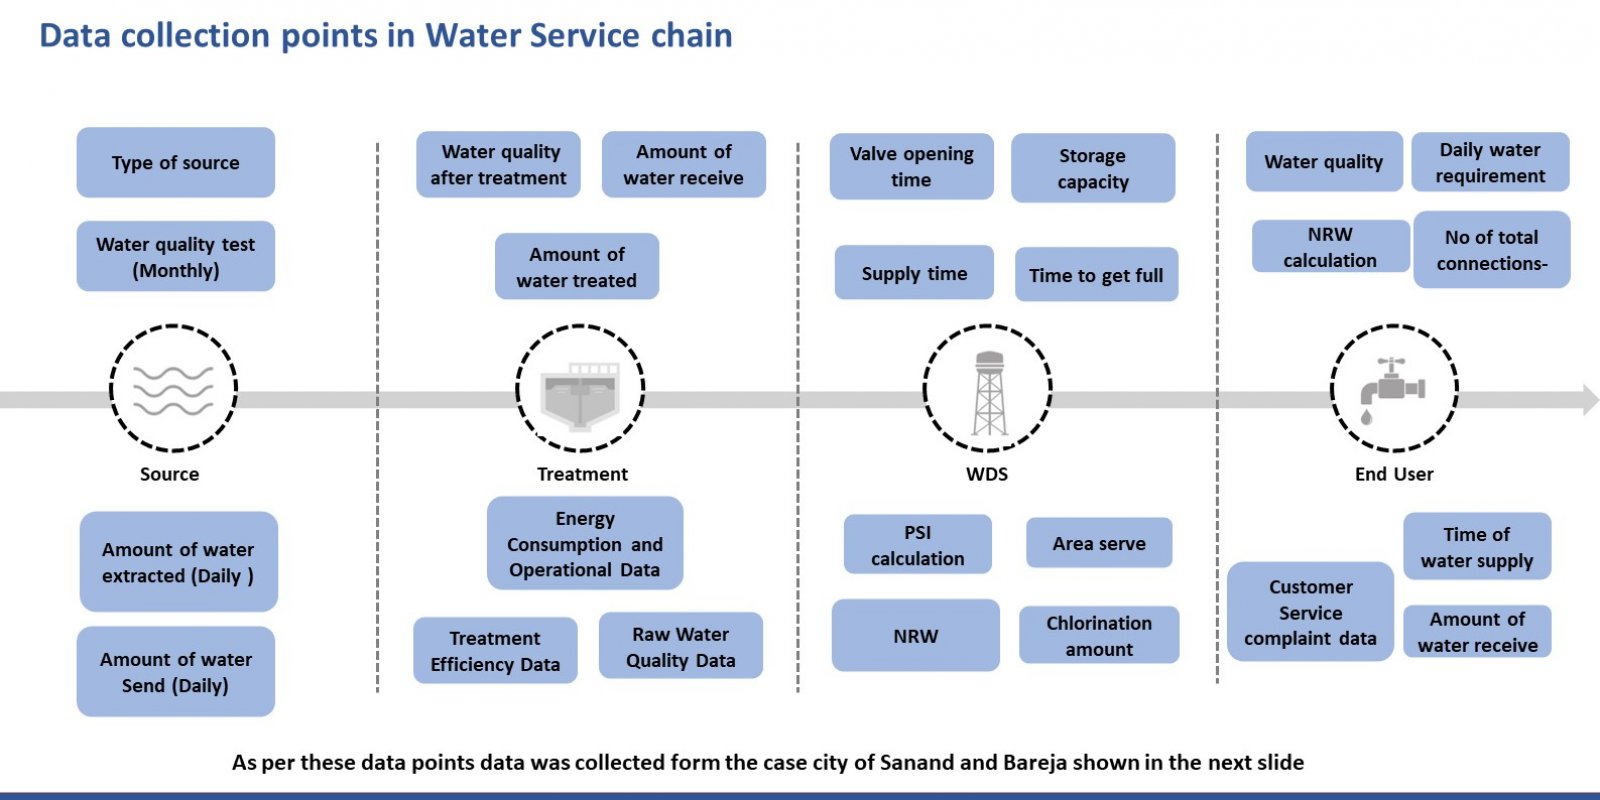
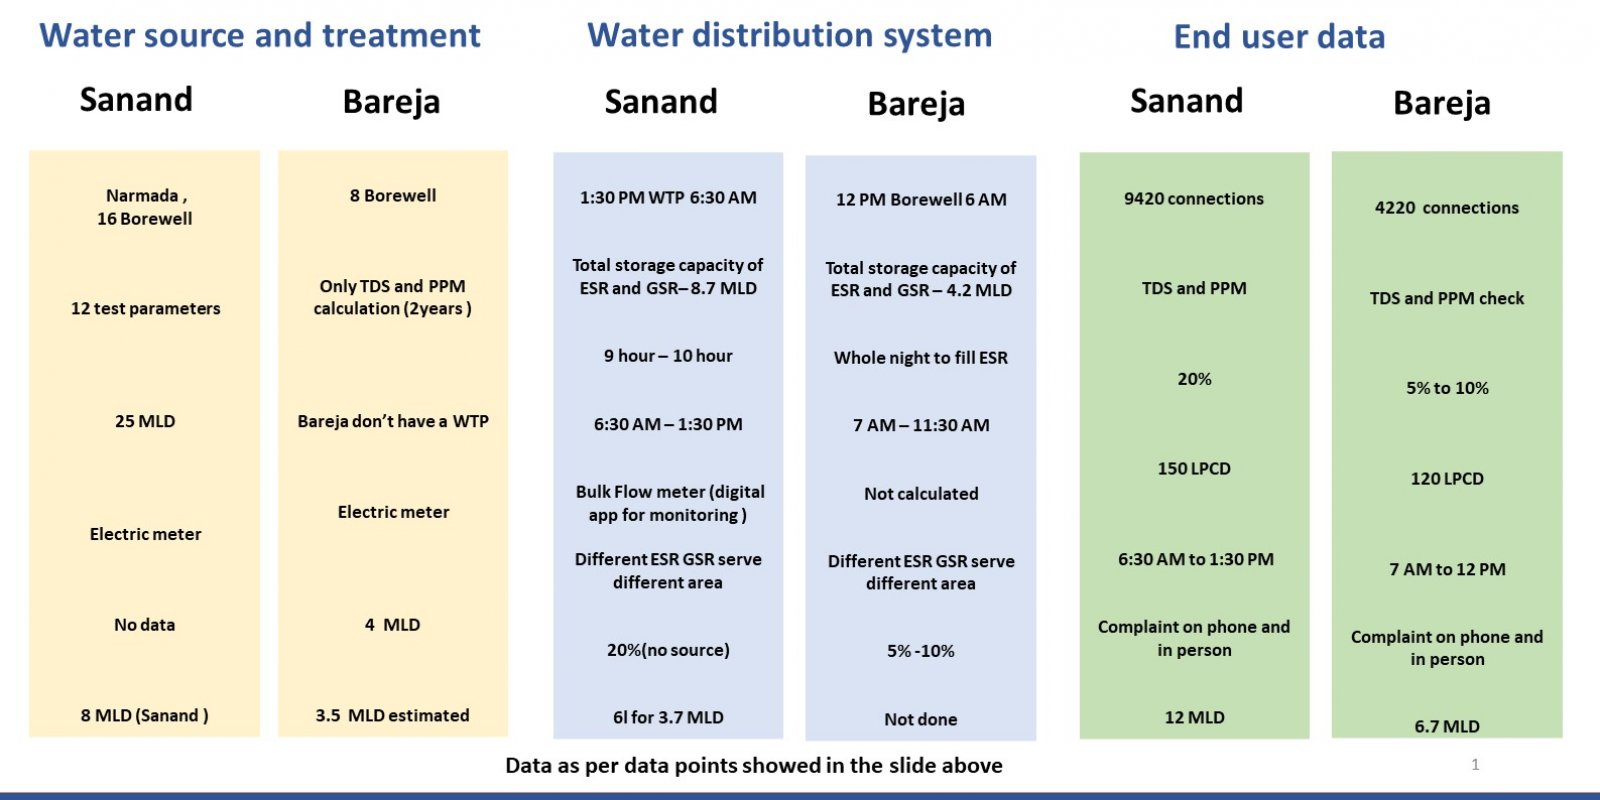
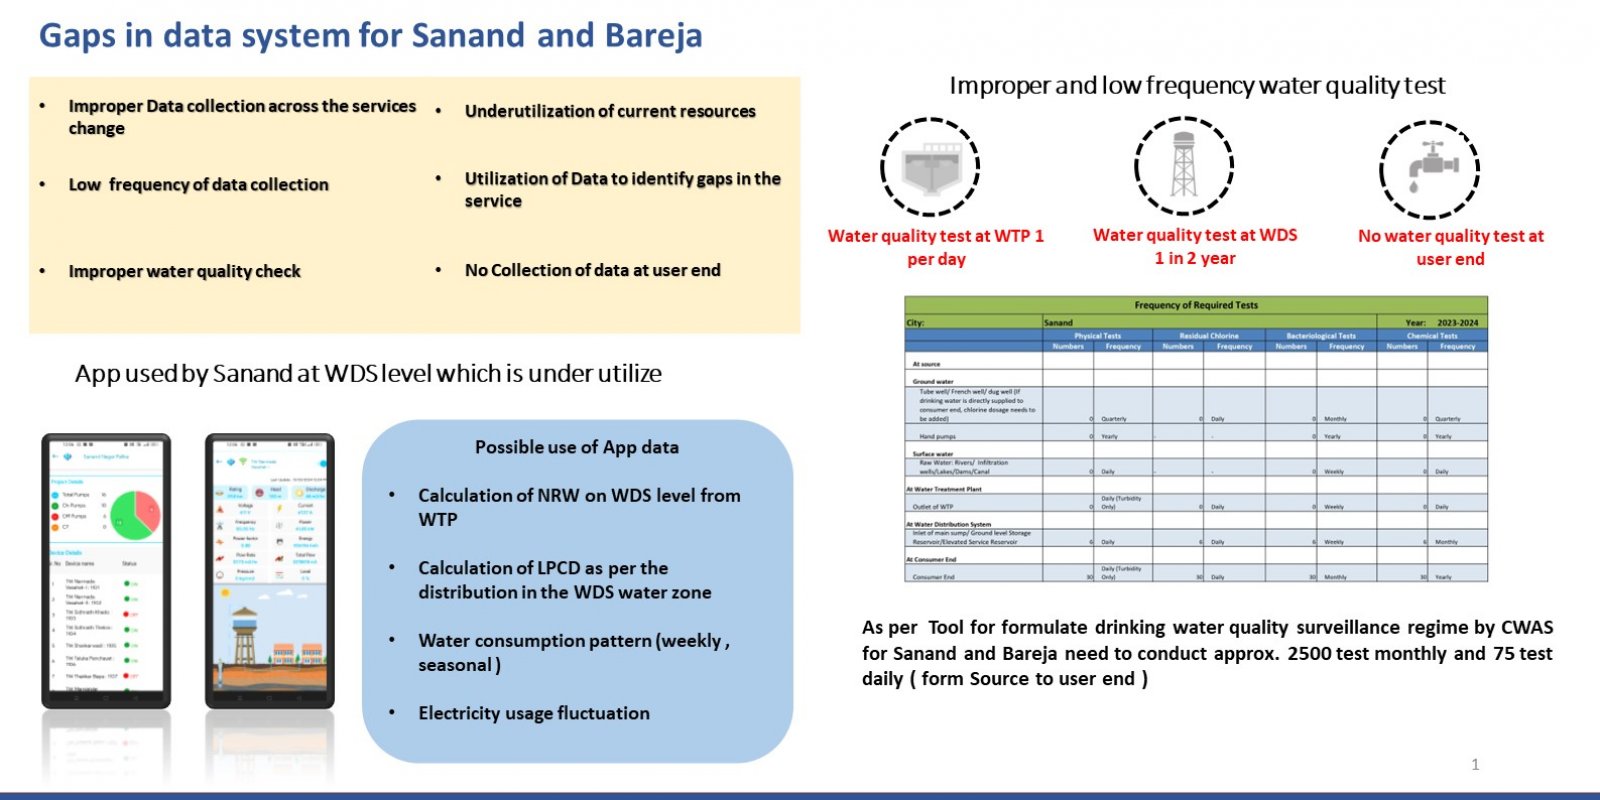
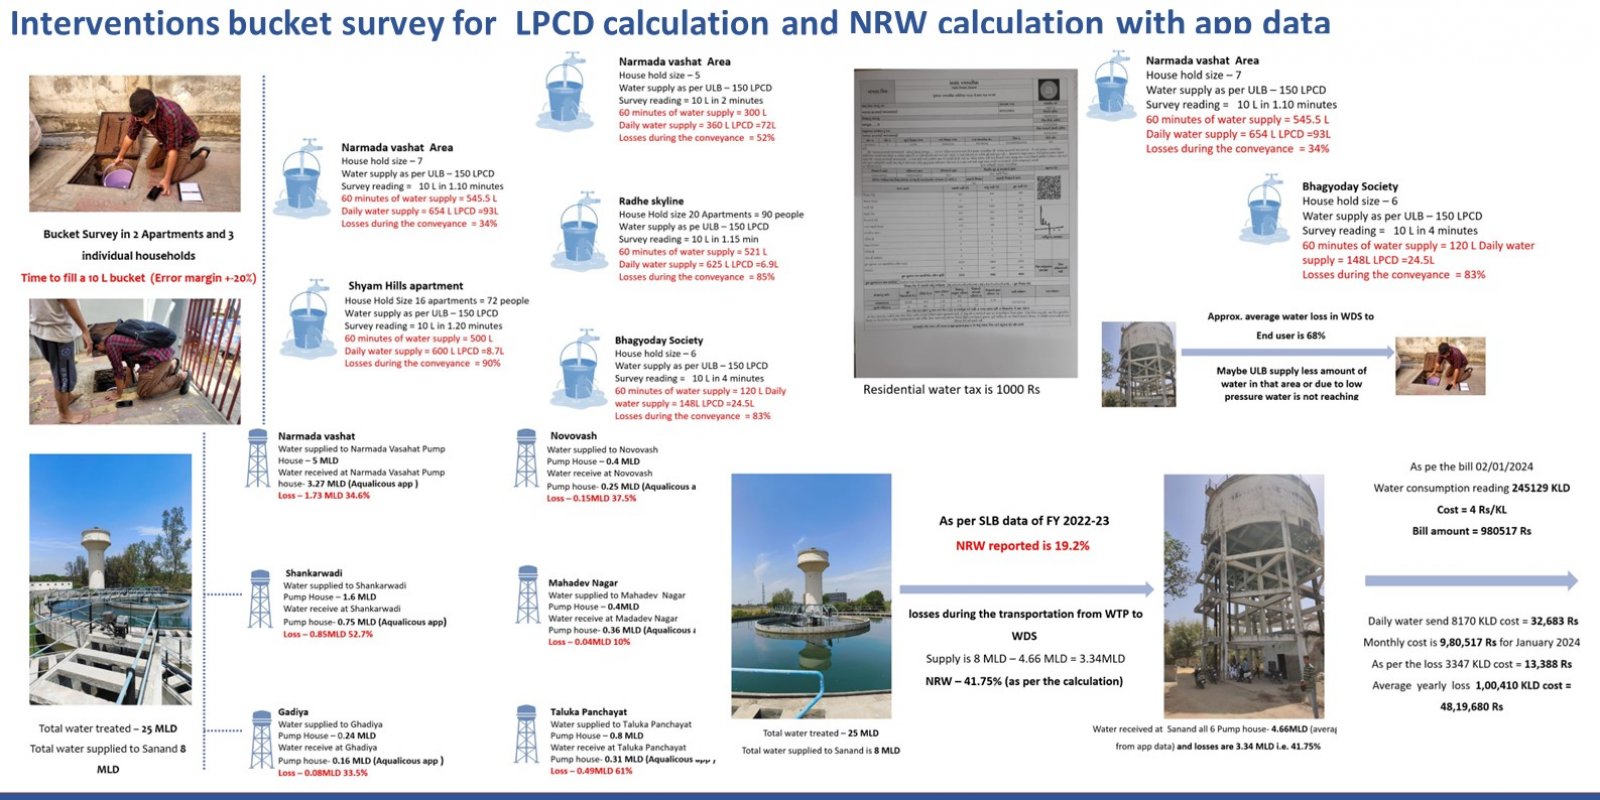
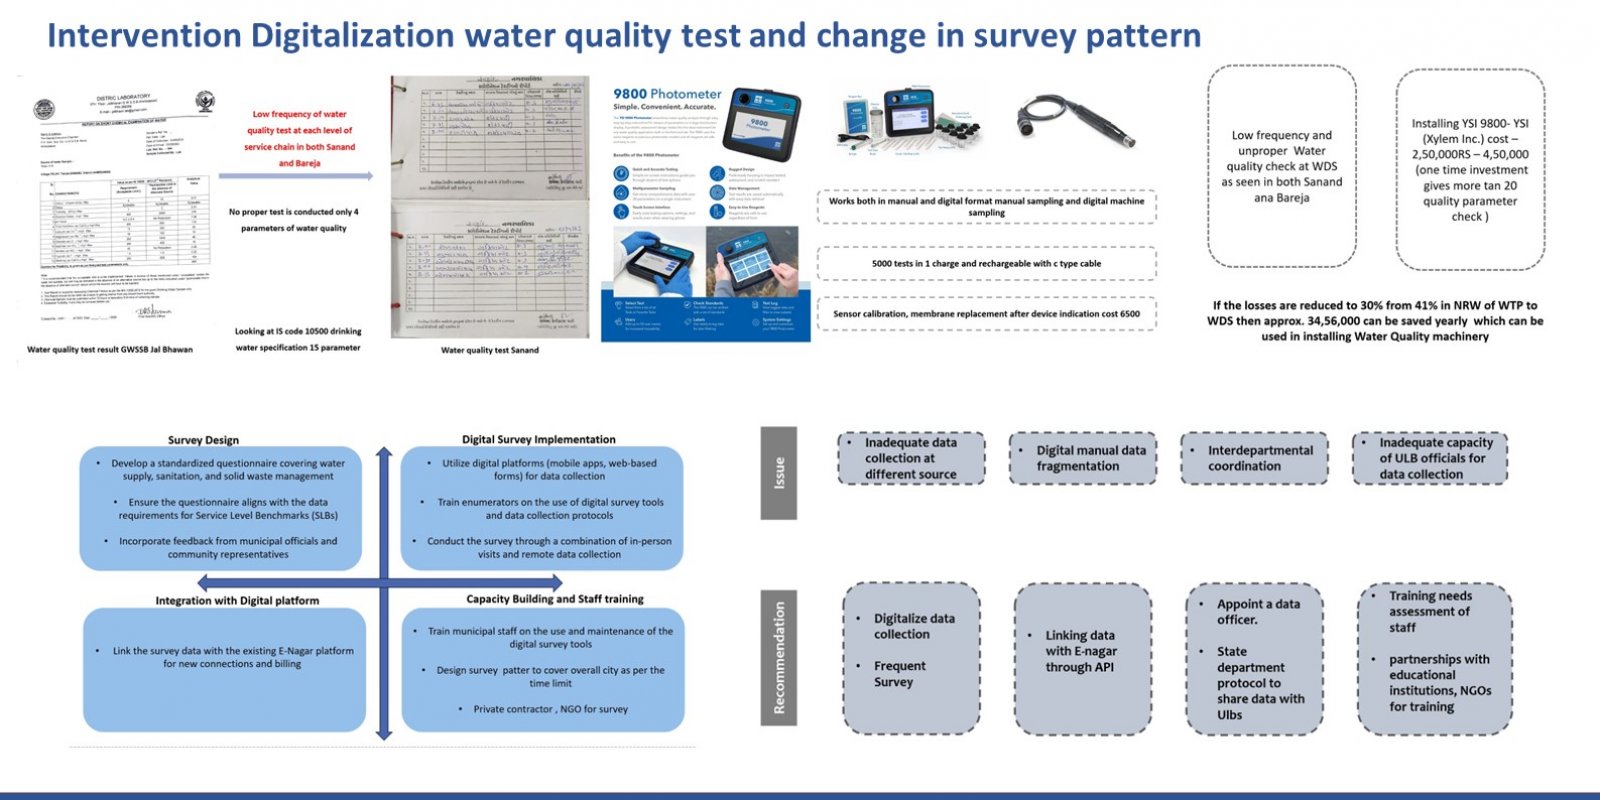
Strengthening municipal data systems for water, sanitation, and waste management is crucial to advancing citizen service, resource allocation, and infrastructure identification. However, these systems face challenges such as incomplete data, inadequate recording instruments, and dependence on conjecture. A thorough review of the literature and case studies examines the current state of municipal data systems services in a few select cities. This analysis highlights the need for change by exposing significant flaws and gaps in for the water sector as per the scope of the research. Technology improvements and capacity building are among the strategies that are suggested in order to strengthen data systems for well-informed decision-making and efficient service delivery. 


Report Content

Overview of problem faced by ULB in current scenario and understanding what is data system and how a proper data system works

Aim, objective , methodology steps and Scope for the DRP

Literature review of government initiative taken for data system strengthening for ULBs also reviewing project done Research Institute / sector Experts made framework for data system strengthening

Overview of the case city selected and looking at water service chain for both the city as per our scope of reserch

Overview of site visit

These were the data points I try to understand with respect to data systems as there are many point that need to consider across water service chain at every stage there are different data point at WTP WDS so I try to identify common point across the vale chain and try to understand how data is collect who maintain that data how data is stored what is the frequency off data collection and what is the frequency that data is updated so we try to understand this with a matrix

Availability of data is their with good frequency still the reliability is lower as we can see NRW which is a major indicator in water supply the city claims to have 20% of NRW but its purely guess based because there is no source of that data or any calculation its jut they need to show 20% At end user majority of data is not maintained and have a very low frequency can be seen in water quality testing with so source of data ULB claims 150 LPCD but never conducted survey

Aqualicous app Built by Design Energy solution and Risen Marketing ( joint venture ) and monthly expenditure of 5lakhs around similar app is used in different city which are class a city has more than 1 lakh population good example smaller city adopting these kind of technology

Intervention Calculating NRW form STP to WDS with the help of ULB data , conducted Bucket survey to analyse ULBs claim for 150LPCD and identifying problems related to hat

Looking at water quality test in both the cities which were not conducted properly as per the water quality parameters suggesting installation of smart multi parameter water quality tester ate WDS level to increase frequency of test and measure according to parameters . Also introducing digitalise survey for end-user data at last as per our analysis and discussion with ULB officials we understand there are two type of gaps where ULB are laging where they don’t know what to do for the data system and if they have the data so they don know how to use that data