Your browser is out-of-date!
For a richer surfing experience on our website, please update your browser. Update my browser now!
For a richer surfing experience on our website, please update your browser. Update my browser now!
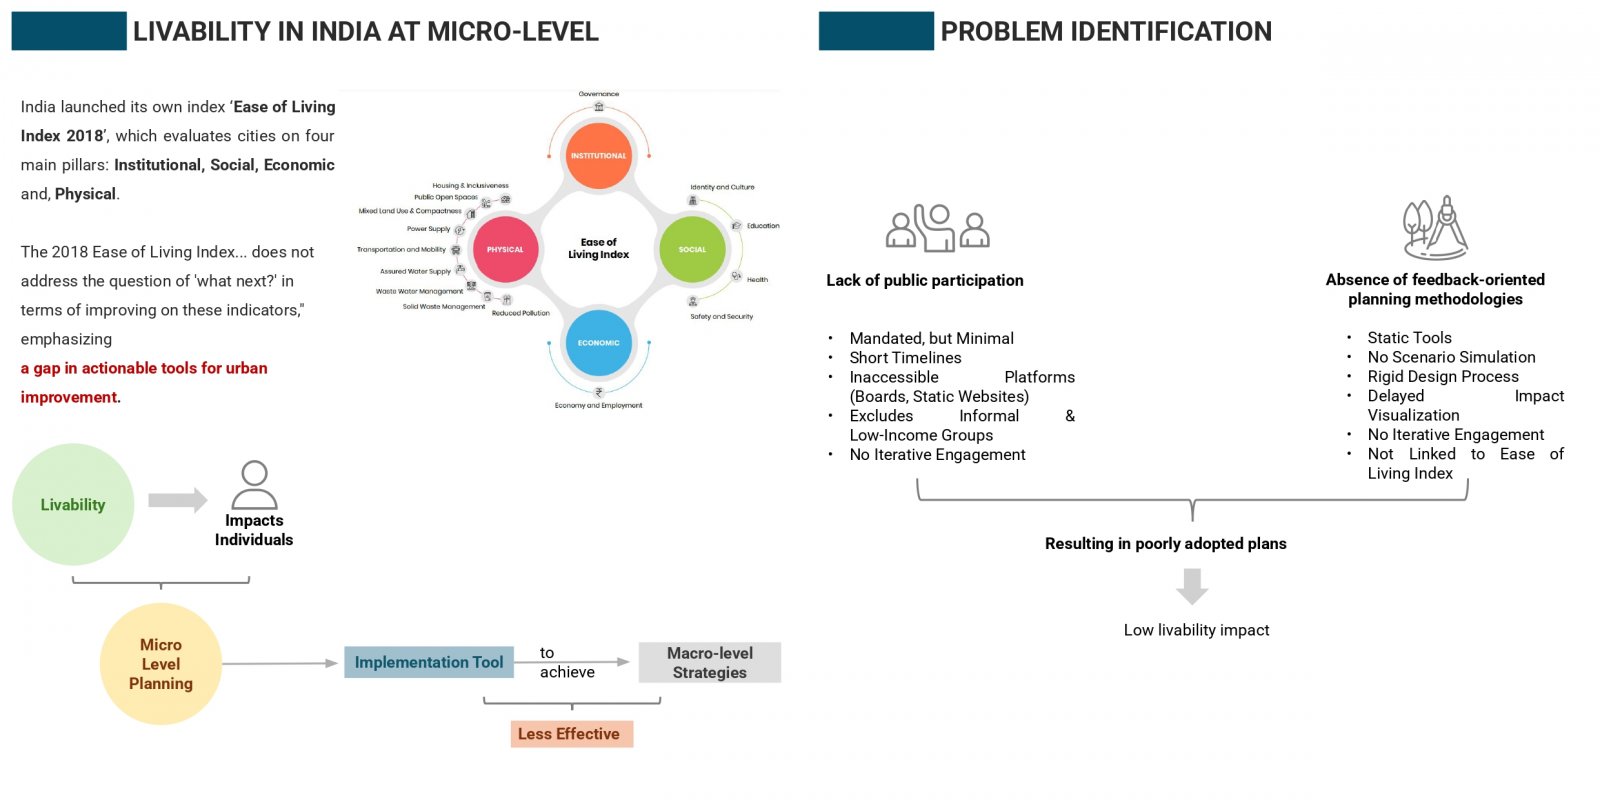
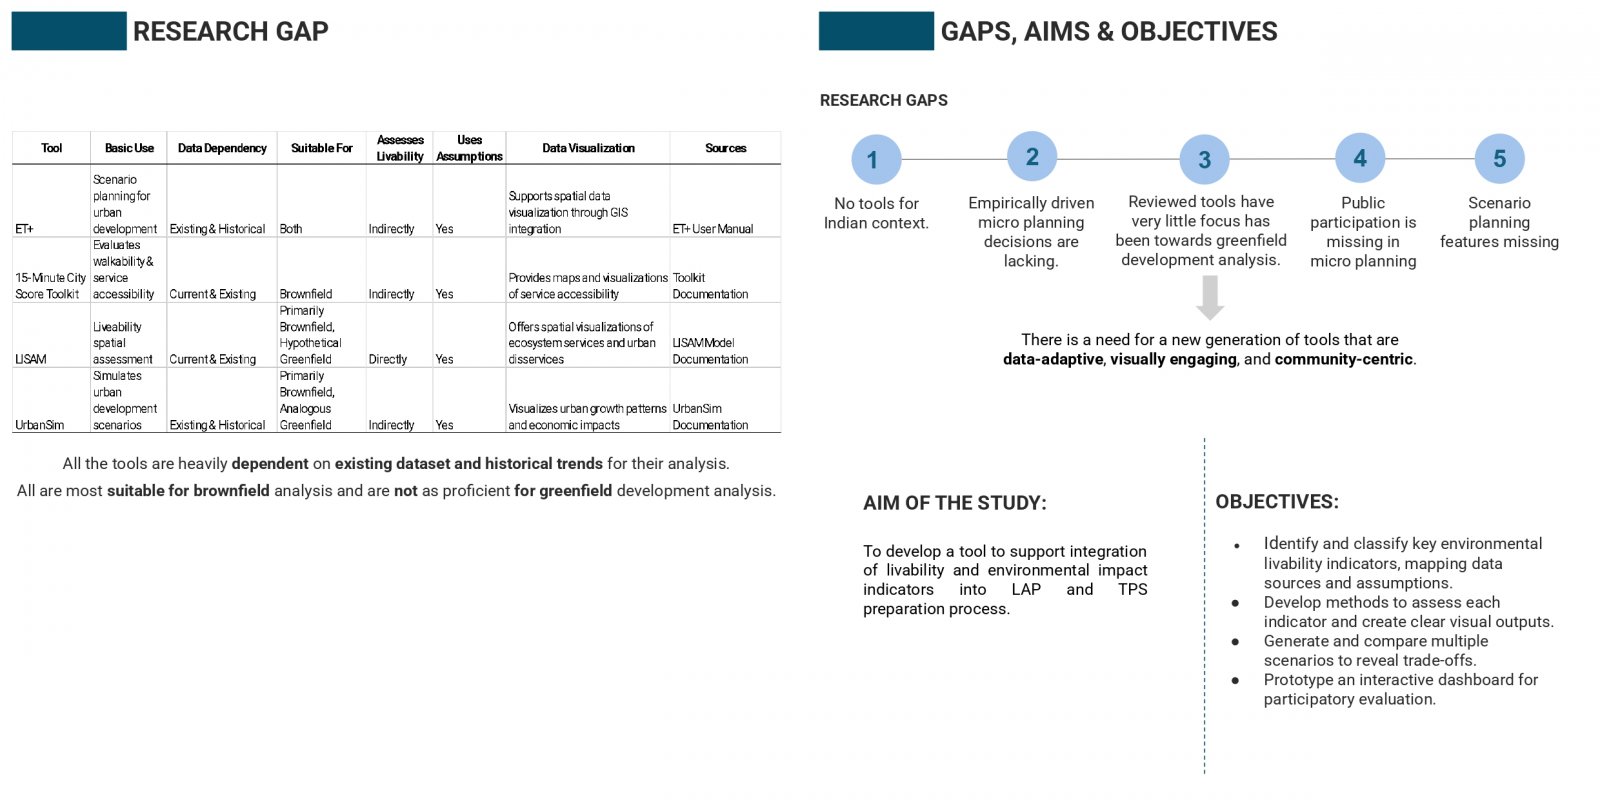
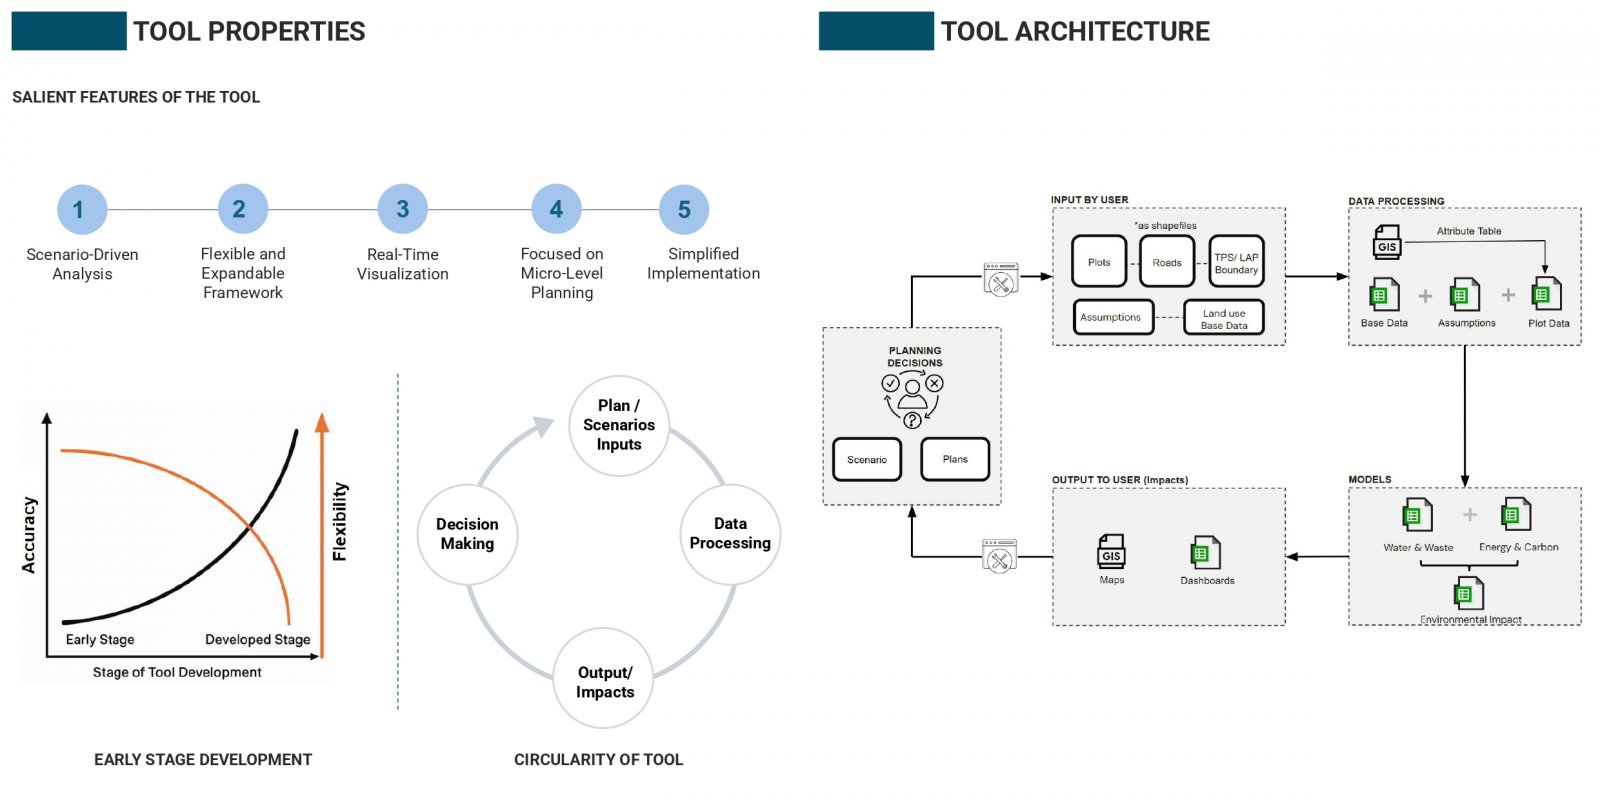
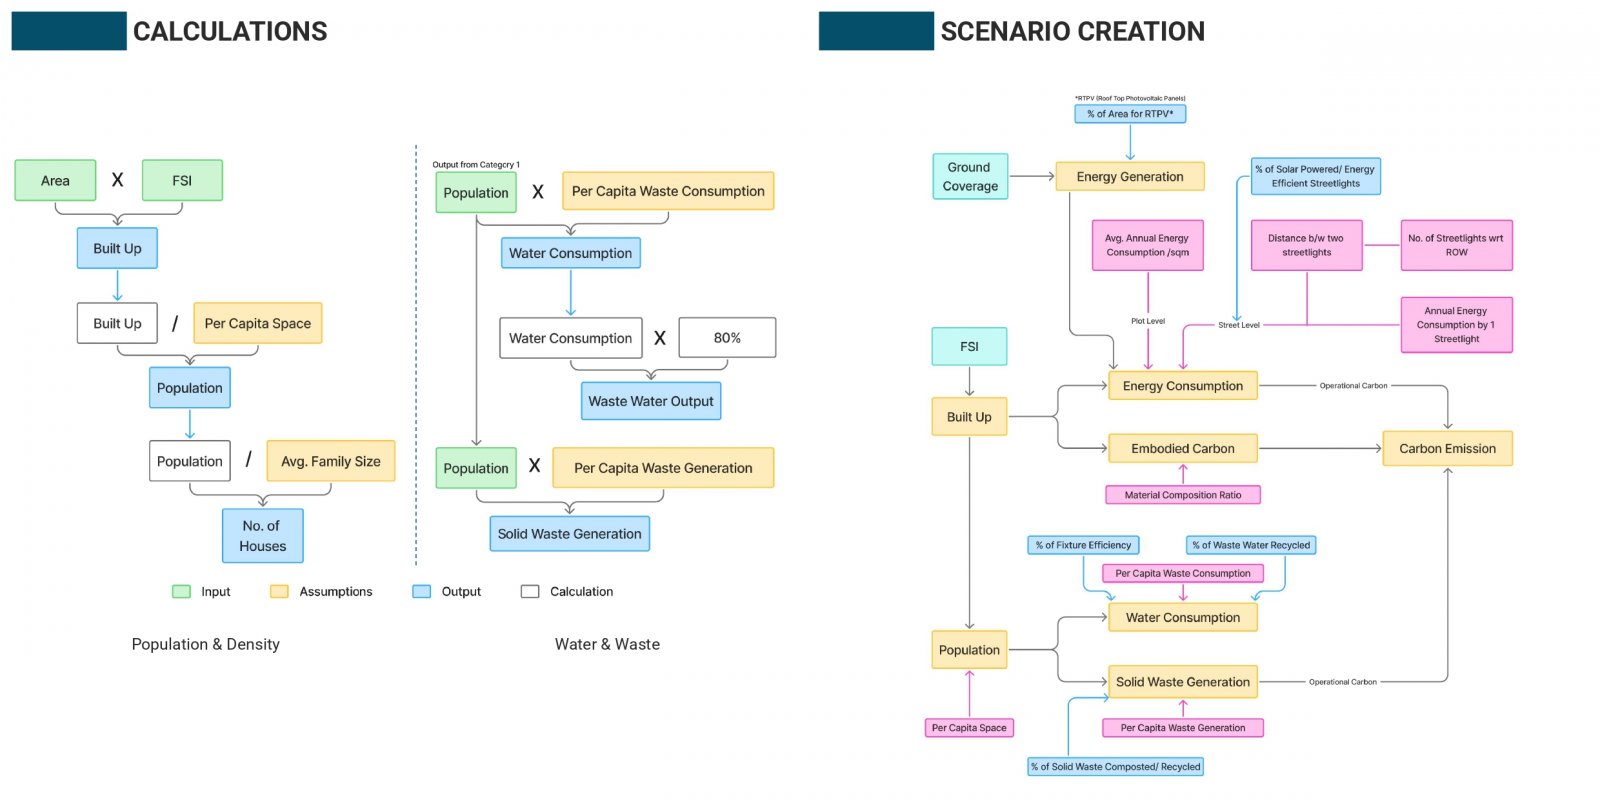
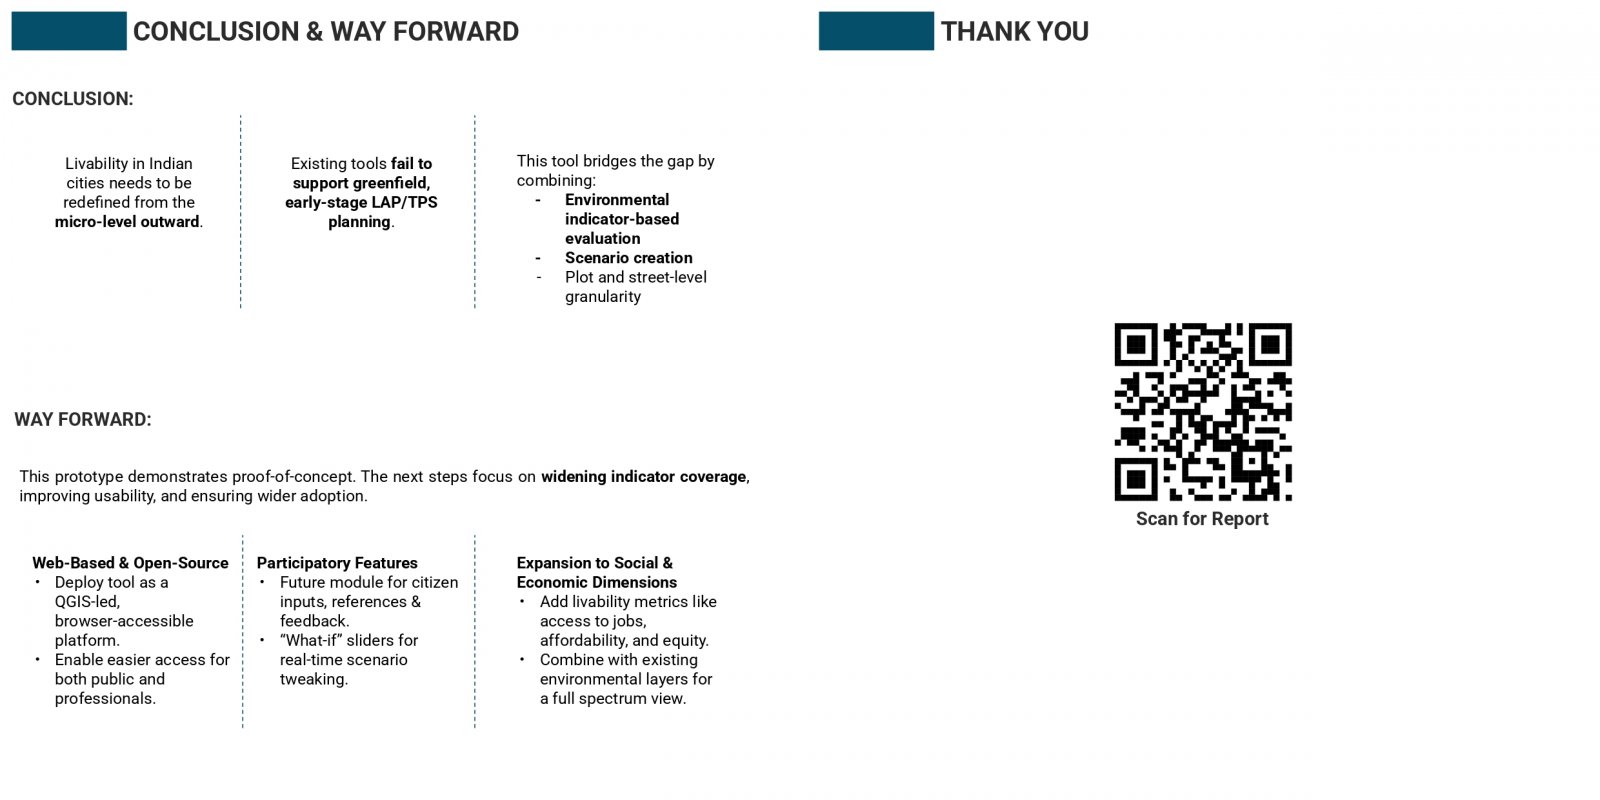
India’s neighborhood-scale planning often fails to translate macro-level visions into livable communities due to static tools and limited public participation. To address this, an Excel-based prototype was created to assess key environmental indicators, water use, energy consumption, and carbon emissions, using customizable assumptions and real-time visual feedback. Its modular structure sets the stage for a QGIS-linked, web-accessible version that integrates spatial layers with interactive dashboards. A case study in Naya Raipur highlights its ability to simulate “what-if” scenarios at the plot level. Future improvements include open-source deployment, citizen participation tools, and inclusion of other livability indicators for holistic urban planning.