Riya Rajesh

UM4002-2

Adoption Strategies

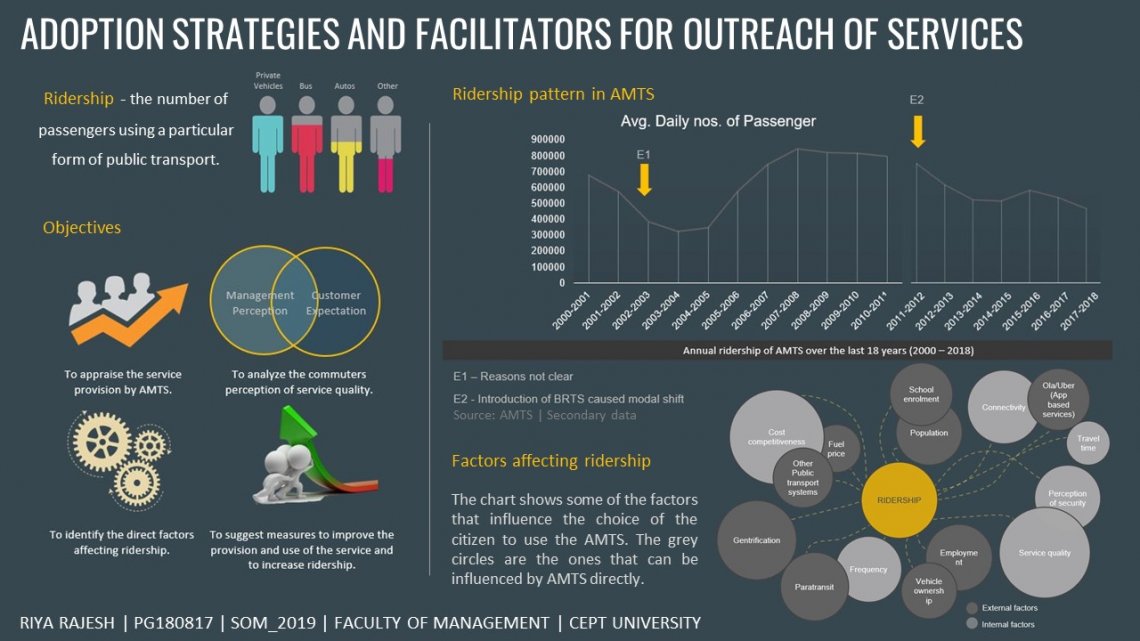
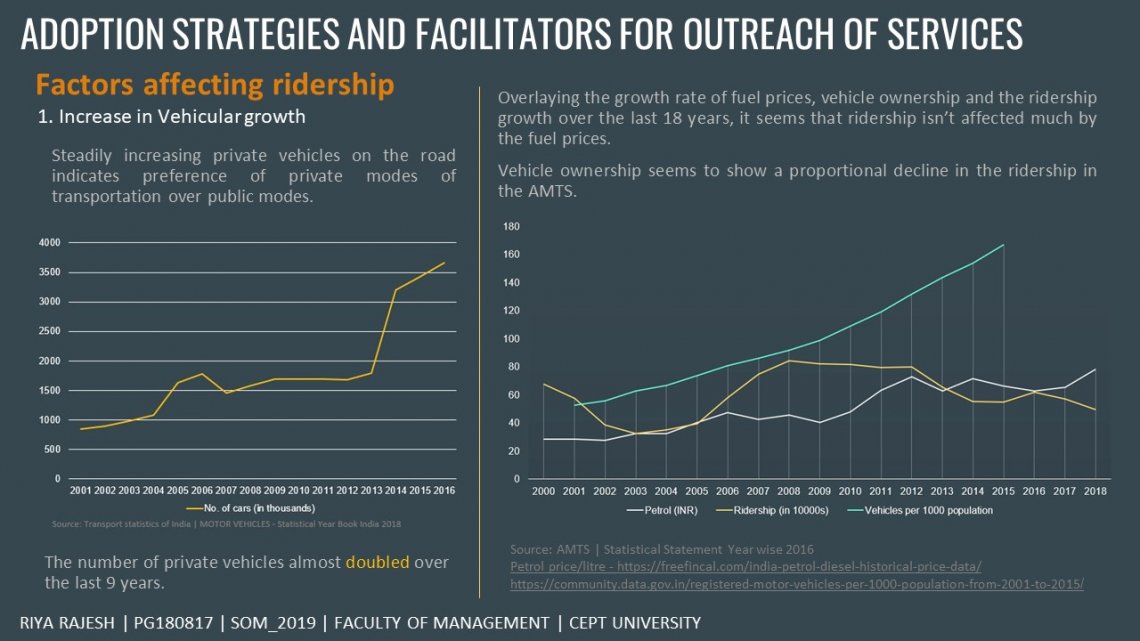
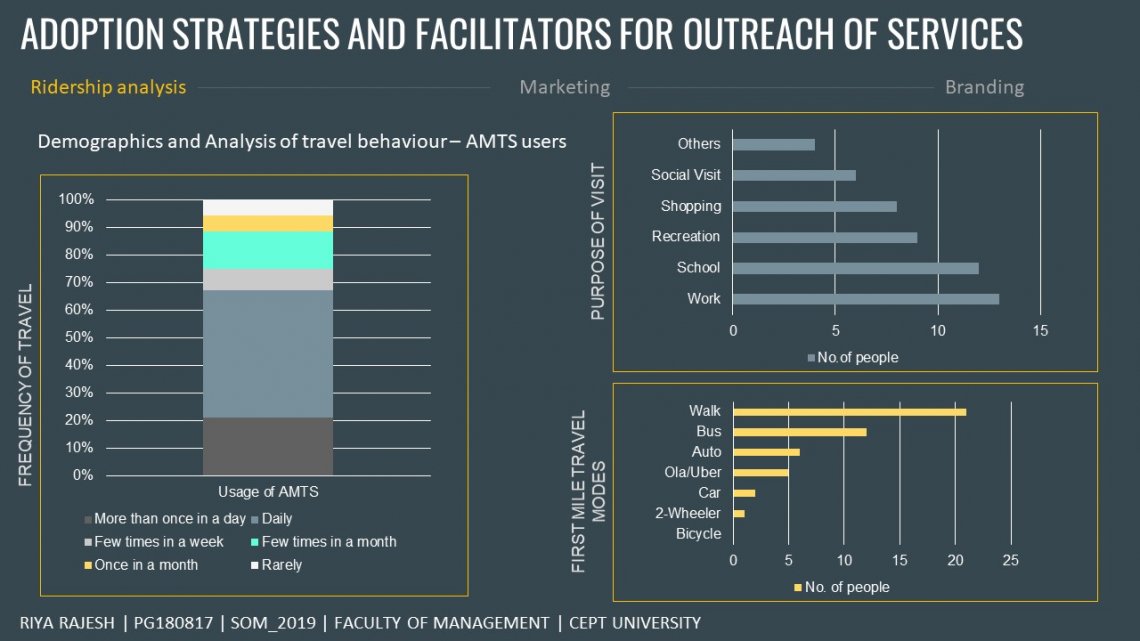
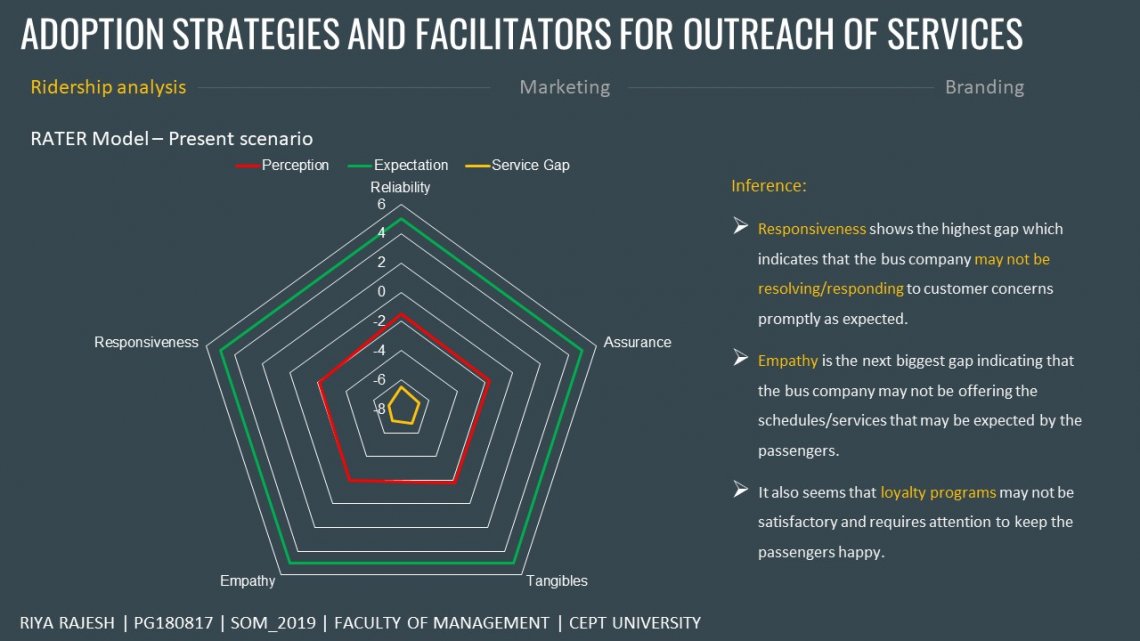
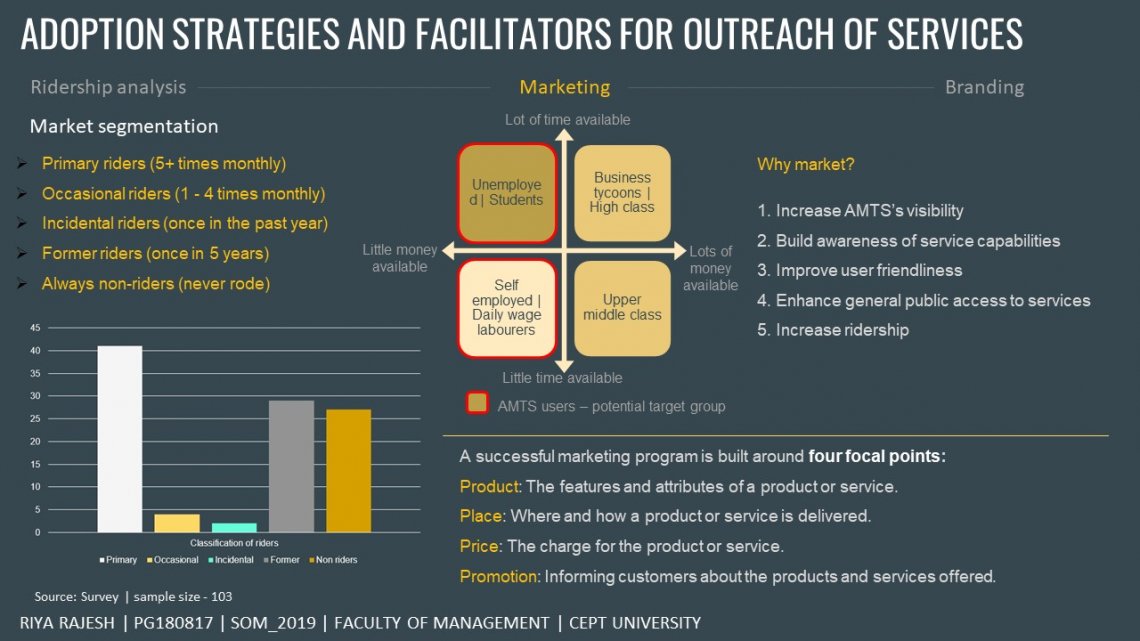
It is essential to analyse the ridership in public transport to understand the shortcomings and potential areas for improvement. The focus of the study was on understanding the stagnation of ridership in the AMTS. Further, the user perception of the service quality of the AMTS was analyzed to identify areas for improvement. Lastly, measures that can be adopted by the service provider to increase the outreach was  suggested. The appraisal of theAMTS is a humongous task and requires a large input of data and human resource. The major part of the study involves interaction with the current users of the service and the non-users of public transport systems in general. The research is fragmented into understanding the current ridership and analyzing the travel behaviors. This is done with the help of the survey which is further supported by the in-depth interviews with the people of the city (users of AMTS and the non-users). This is followed by the understanding the market segments and identifying marketing techniques for the various segments. Finally, it concludes with the exploration of the idea of re-branding the AMTS to help with the outreach of services and increasing the visibility of AMTS which will eventually increase ridership.


Report Content

The main objective was to analyze the ridership to identify gaps in the service delivery of the AMTS. The graph above depicts the ridership pattern over the past 18 years. Ridership has been steadily declining since 2011. Many factors can affect the ridership, introduction of the BRTS being the most recent.

The price of fuel and vehicle ownership can affect ridership as well. Although, the graph above is suggestive that ridership is not adversely affected by change in fuel prices but more or less impacted by the increase in private vehicles.

On conducting a survey (sample size: 103), it became apparent that the majority of the respondents used the AMTS very frequently to travel to work or school. Their first mile connectivity was by foot which indicates that the dependency on feeders is quite less amongst the AMTS users.

SERVQUAL is a tool designed to analyze the gap between the customer expectation and perception. Through the survey, it is evident that the AMTS has not met the passenger expectation in two domains - responsiveness and empathy.

It is clear from the graph above that the AMTS service quality can be improved sufficiently by increasing the efficiency of information sharing amongst the users. Further, AMTS can retain customers by acknowledging long time riders through loyalty points (rider miles).

Through the Ishikawa diagram, the root cause for the loss of ridership in AMTS was analysed. This helped in narrowing down domains that required immediate focus in achieving better ridership. Poor service quality of the AMTS seemed to the major contributing factor for the loss of passengers.

From the SWOT analysis, it is clear that by working on the visibility of the AMTS, through re-branding the service, it can be made more appealing to the public. Further, utilization of the technological interventions made in the service can increase efficiency in terms of service quality and delivery.

It is essential to understand the market to improve any factor in the service. Primary riders are the ones who avail the service on a regular basis (>5 times in a month). Primary riders are composed of people who either have lot of time and little money or little time and little money. So the service should cater to their demands. Any service marketing has 4 main aspects - Product, price, promotion and place.

Analysing the 4 P's, it is evident that the product itself contributes to the lack of usage of the AMTS. Improving the product can help in retaining/increasing the ridership in AMTS.

The table above gives a suggestive schedule and recommendations for improving the service quality and closing gaps in the service delivery in the AMTS.