Your browser is out-of-date!
For a richer surfing experience on our website, please update your browser. Update my browser now!
For a richer surfing experience on our website, please update your browser. Update my browser now!
“A Developed country is not a place where the poor have cars; it’s where the rich use public transportation” - Mayor of Bogotá
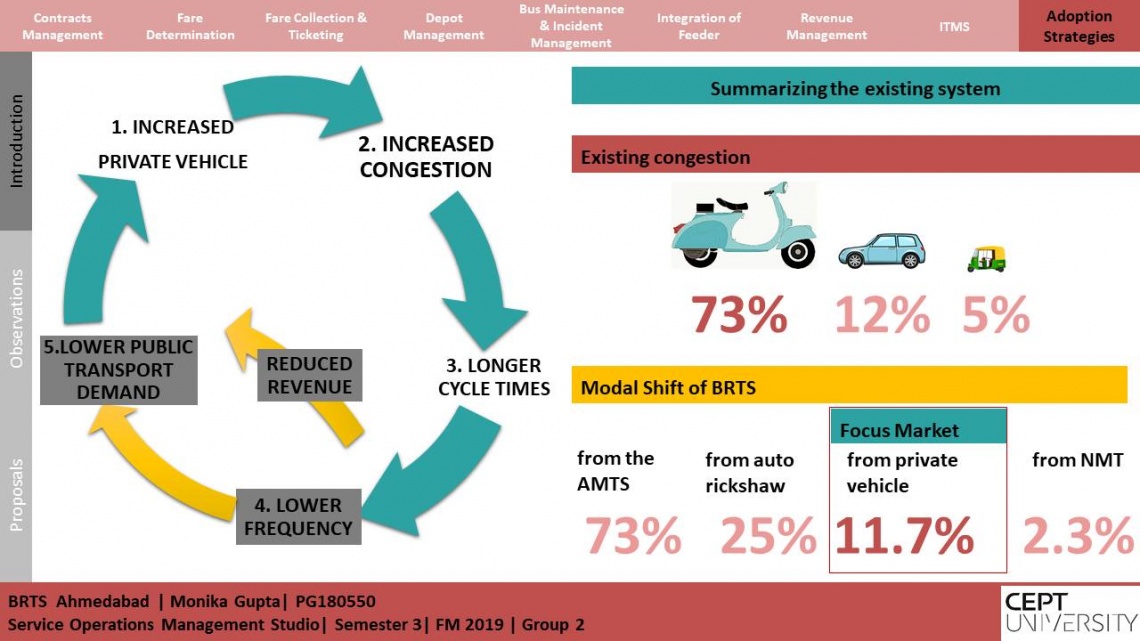
At the beginning of 2015, approximately 74 percentage of aggregate passenger-trips in India were via recognized public transport services (MoRTH, 2o16), provided majorly by sixty two State-owned Road Transport Corporations. There was exponential vehicular development in the country. The rate of increase has been 6.2 in the last two decades. This hike was due to expansion in private vehicle development, and has brought about decreased traffic rates and endemic road blocks in many urban areas. Because of the expansion of single or low-inhabitance vehicles, the decrease in the modular sector of open transport is a reason for concern. Expanded clog levels have added to the absence of quality of public transport administrations.
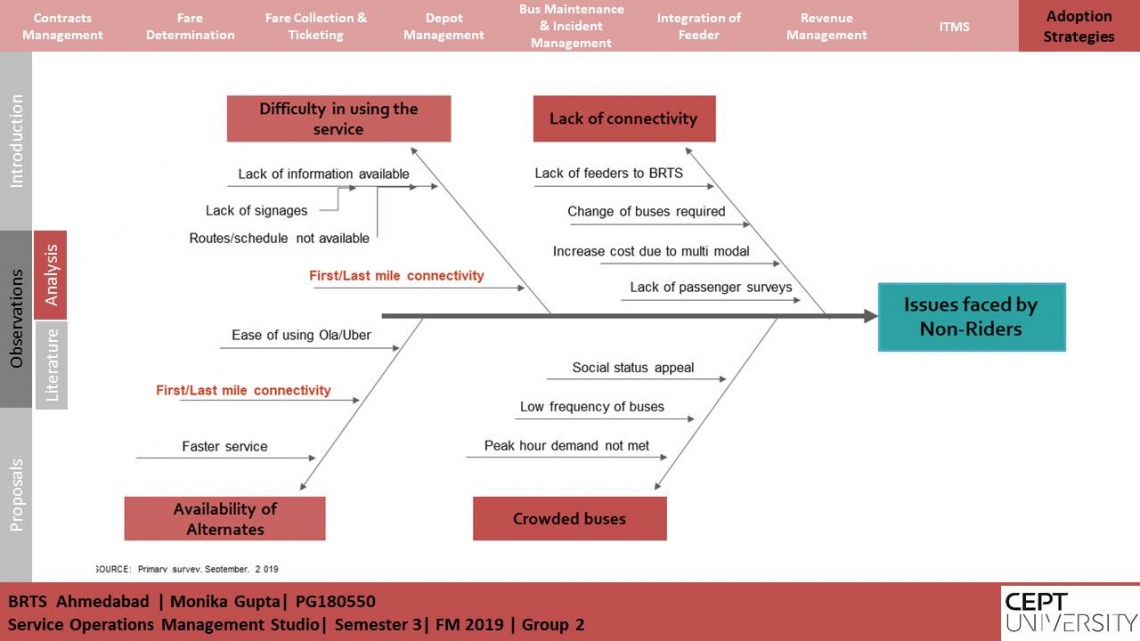
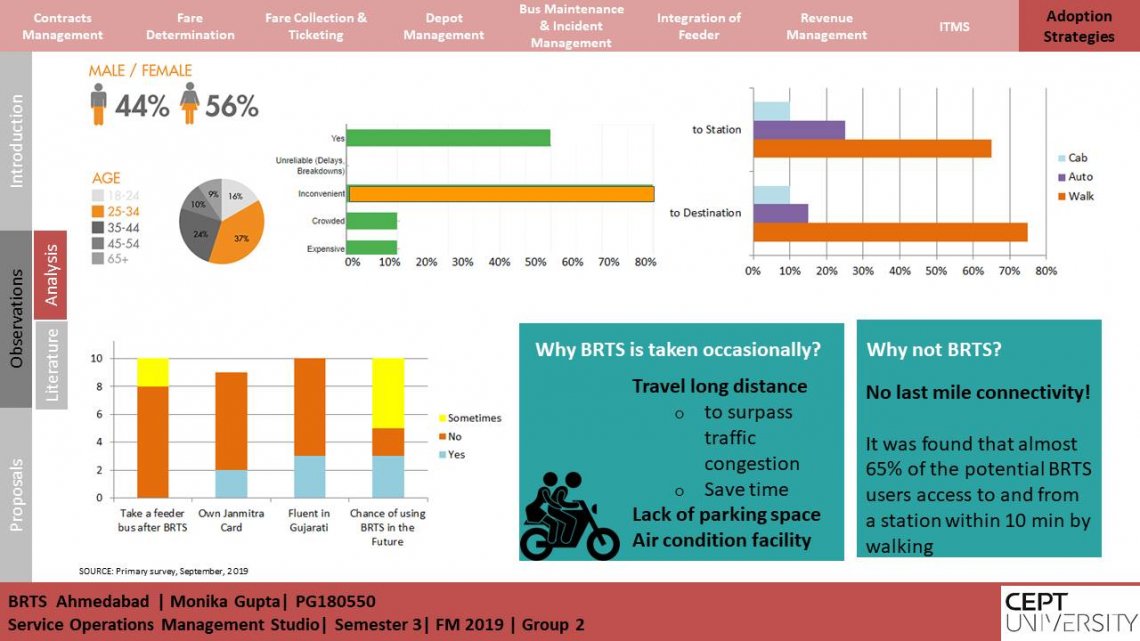
It is difficult to choose between private vehicles and public service as there are different influences. Excursion quality, for example, time of outing and consistency of outing, motivations behind outing, and statistic attributes such as age, gender and pay level, are among the huge influences. Likewise, as the age and salary of an individual increases; there is a decrease in the utilization of public transport. Other secondary solid influences are out of the pocket cost of travel, nature of administration, the proximity of the bus stop from the start point and nearness of destination from the station.
Pulling in individuals to utilize public transport has never been simple. Private vehicles have regularly been the preferred choice over general transport. The test is much more prominent in rural settlements and smaller urban areas where factors such as ample parking area, and congestion free driving conditions have defended the utilization of private vehicle as a mode of transit. As the quantum of public transport riders keeps on falling, this in turn reduced the revenue for the municipalities and hampered the overall investment in maintaining and improving the quality of the bus service. The subsequent decline compromises the feasibility of public transport and leaves travel specialists battling to work out how to produce the income required to keep up the service of public transportation. In fact, in numerous urban communities it is indistinct how travel specialists and city pioneers will fund their vows to address air quality concerns and reduce the carbon footprint of public transport by moving to electric transports—particularly increasing their capital expense.
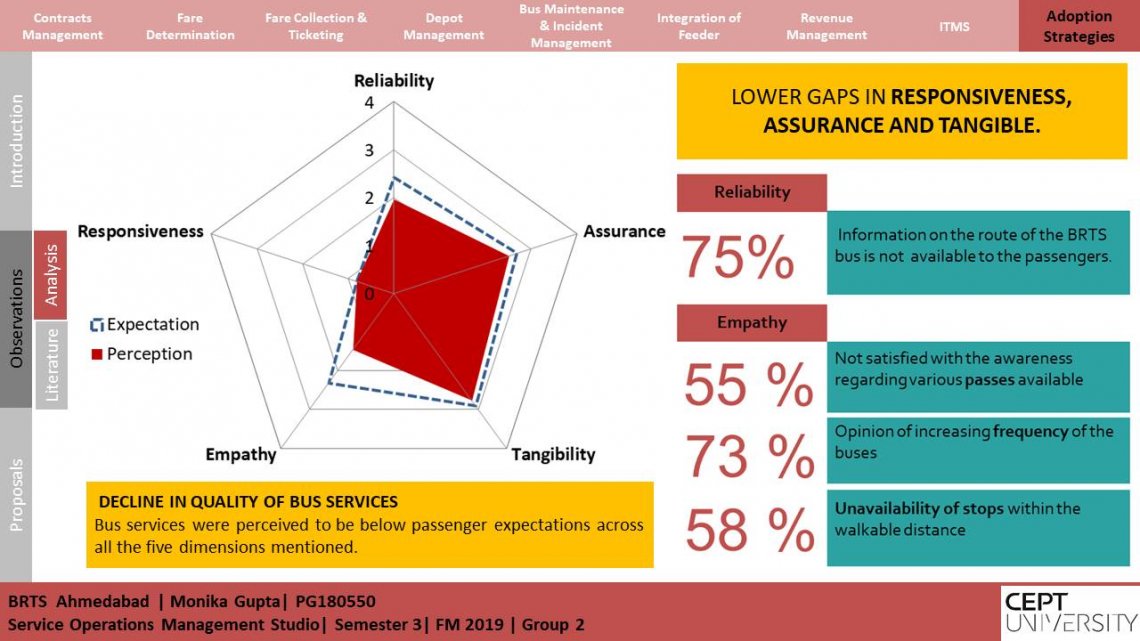
Vulnerability in transport frequency and its effect on waiting times at transport stops dishearten public transport utilization. In spite of the fact that most STUs are monetarily obliged, some are putting resources into Intelligent Transport Systems (ITS), including Vehicle Tracking Units and Passenger Information Systems (PIS), to increase the dependability on public transport.