Your browser is out-of-date!
For a richer surfing experience on our website, please update your browser. Update my browser now!
For a richer surfing experience on our website, please update your browser. Update my browser now!
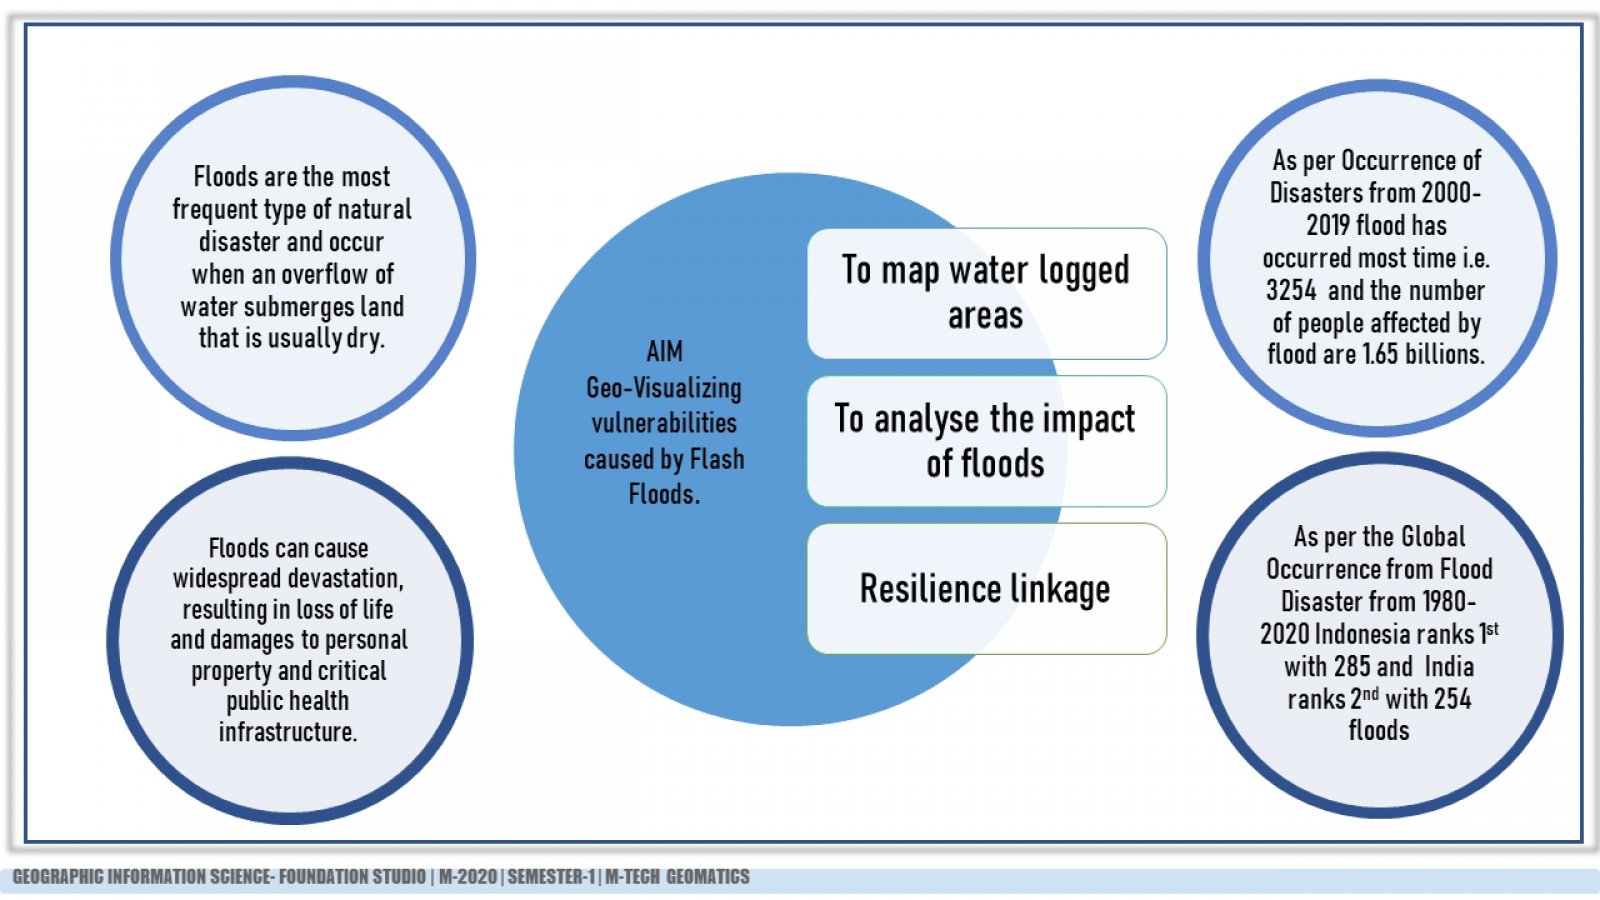
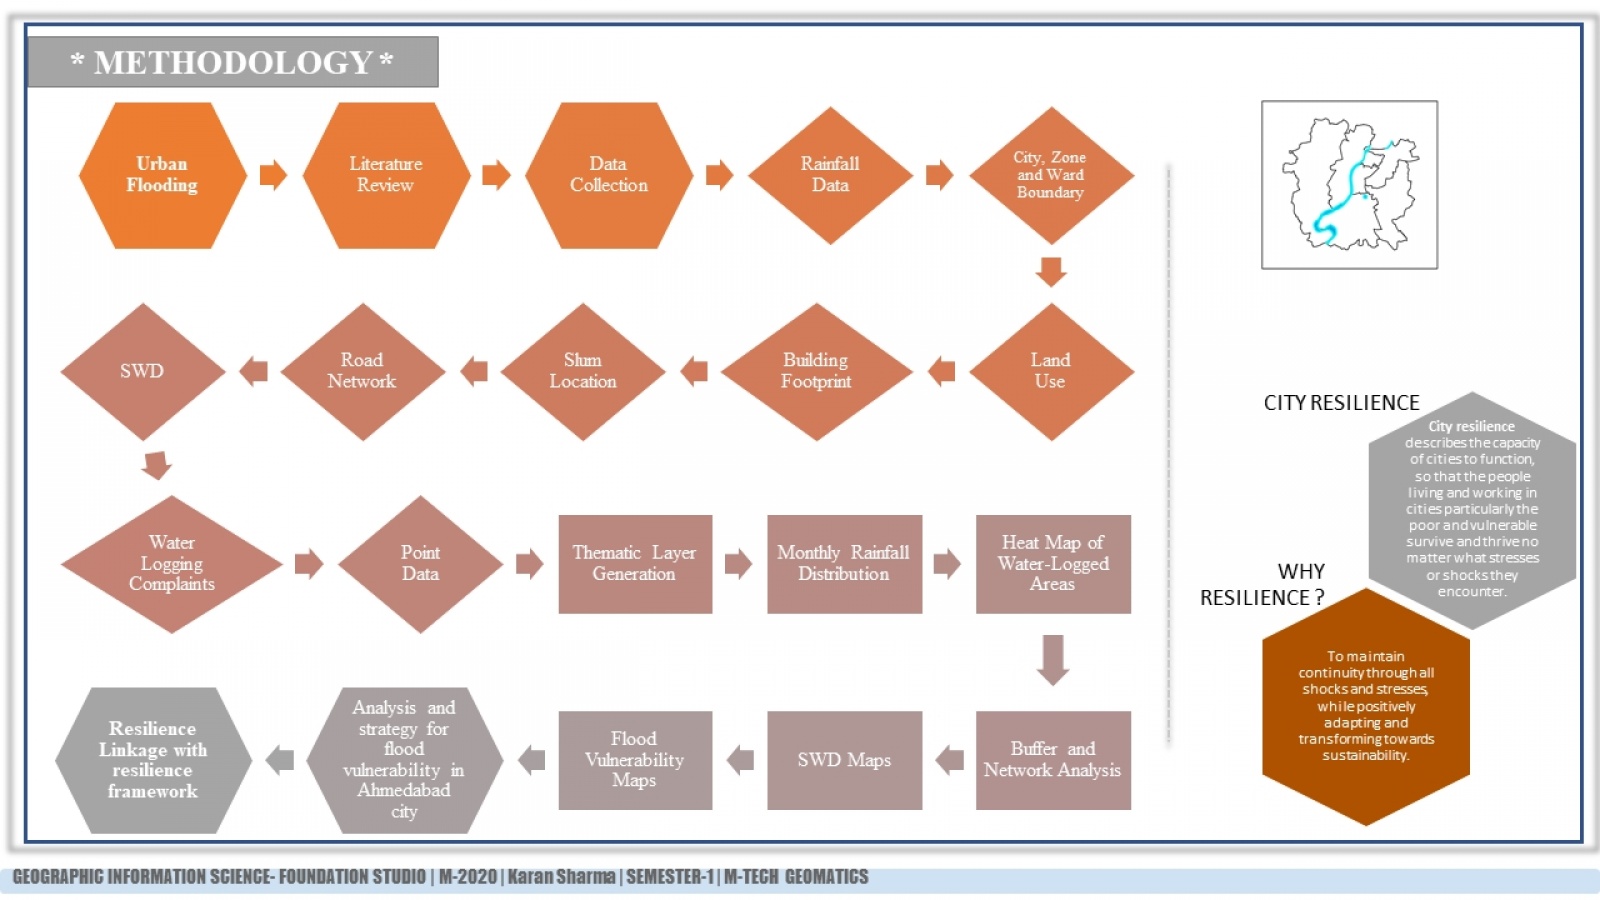
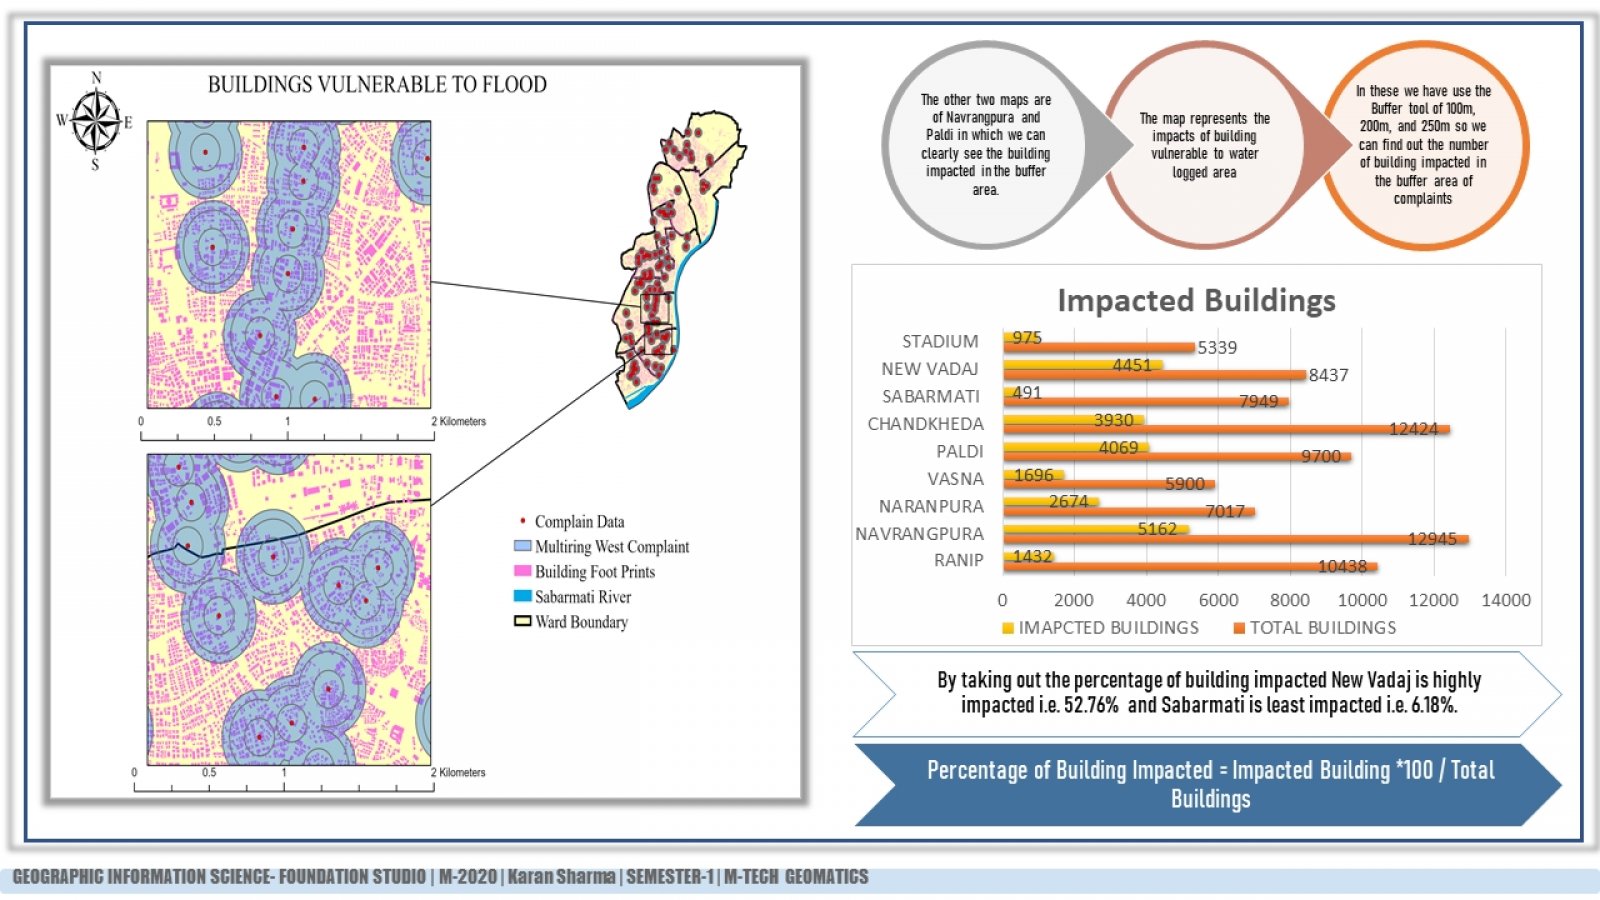
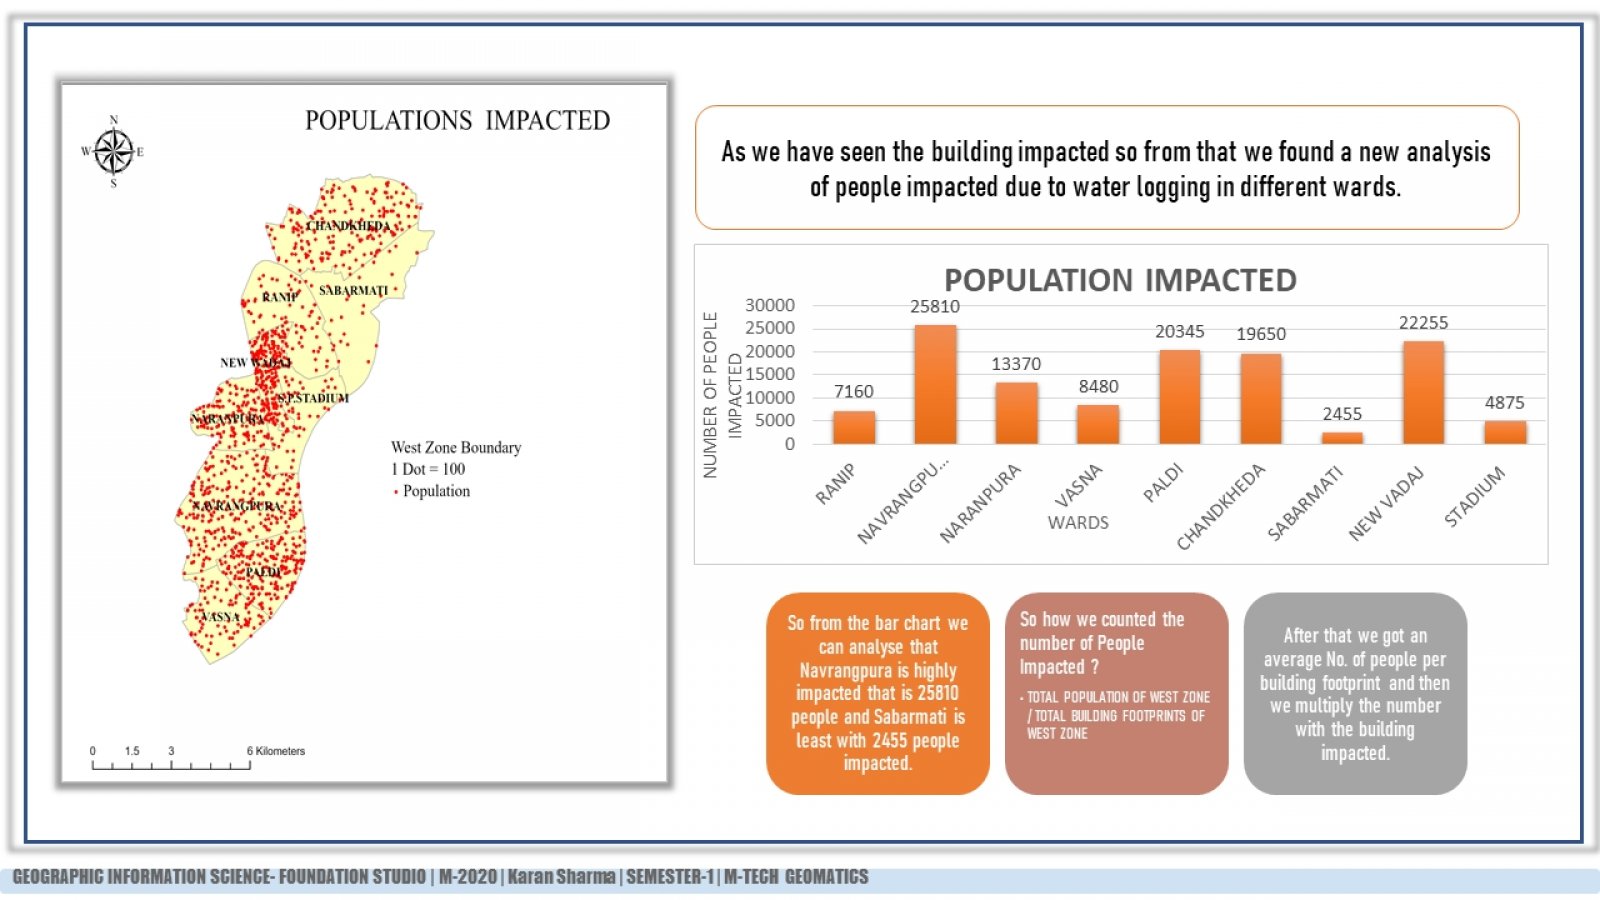
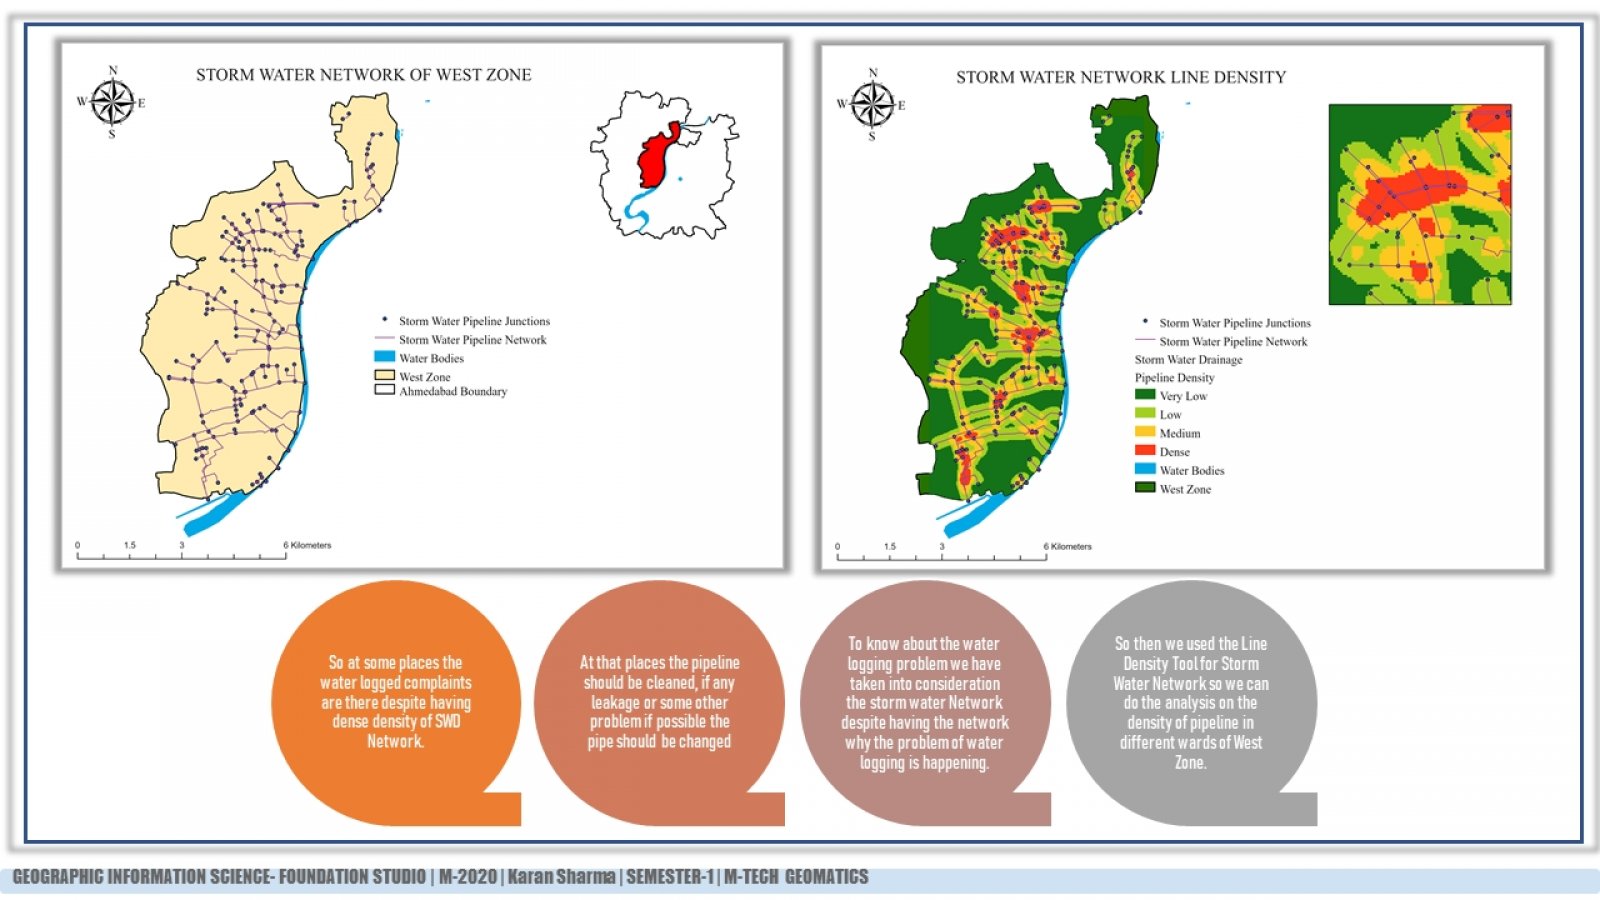
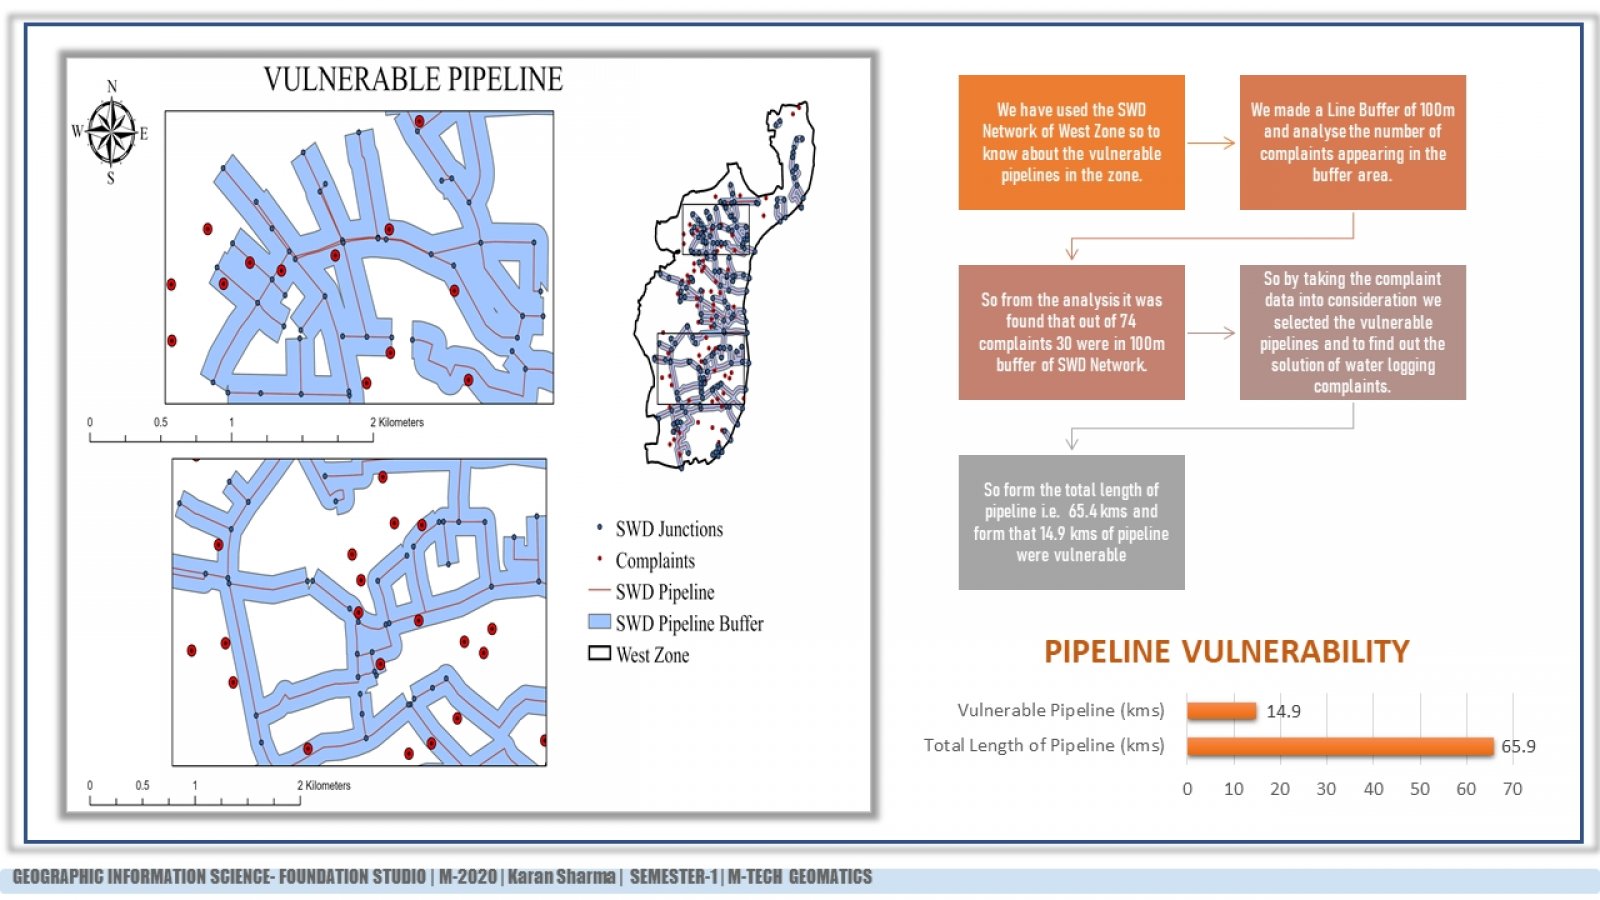
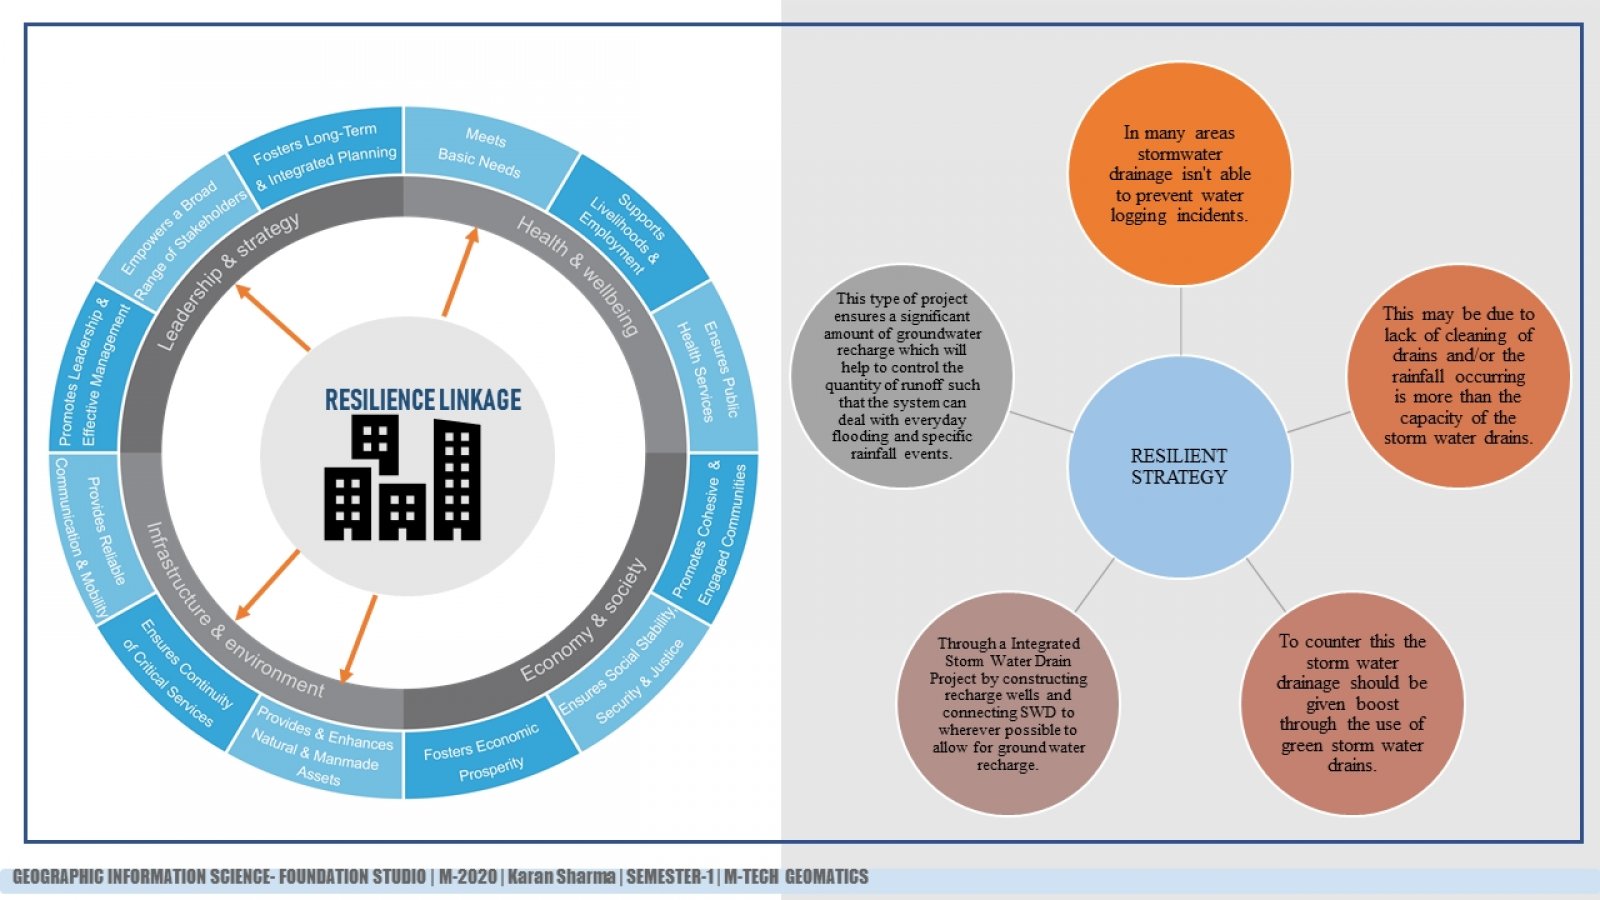
As our studio was on resilience city so we have taken the urban flood as a hazard. So in that we have taken the water logged complaints as a source to find about the building vulnerable to flood and from that we found the number of people impacted through it. Then we had the Storm Water Drainage Network of West Zone so we have taken out the density of pipeline and know the lowest and highest density of pipeline we also consider the vulnerable pipeline and found out the length of vulnerable pipeline and we connected with the resilience indicators.